决策树算法与案例
决策树算法介绍
树模型
决策树:从根节点开始一步步走到叶子节点(决策)。所有的数据最终都会落到叶子节点,既可以做分类也可以做回归
树的组成
根节点:第一个选择点;非叶子节点与分支:中间过程;叶子节点:最终的决策结果
增加节点相当于在数据中切一刀。
决策树的训练与测试
训练阶段:从给定的训练集构造出来一棵树(从跟节点开始选择特征,如何进行特征切分)
测试阶段:根据构造出来的树模型从上到下去走一遍就好了
一旦构造好了决策树,那么分类或者预测任务就很简单了,只需要走一遍就可以了,那么难点就在于如何构造出来一颗树,这就没那么容易了,需要考虑的问题还有很多的!
如何切分特征(选择节点)
问题:根节点的选择该用哪个特征呢?接下来呢?如何切分呢?
想象一下:我们的目标应该是根节点就像一个老大似的能更好的切分数据(分类的效果更好),根节点下面的节点自然就是二当家了。
目标:通过一种衡量标准,来计算通过不同特征进行分支选择后的分类情况,找出来最好的那个当成根节点,以此类推。
衡量标准-熵
熵:熵是表示随机变量不确定性的度量(解释:说白了就是物体内部的混乱程度,比如杂货市场里面什么都有那肯定混乱呀,专卖店里面只卖一个牌子的那就稳定多啦)
公式:H(X)=- ∑ pi * logpi, i=1,2, … , n。(越大的概率得到的熵值越小)
一个栗子: A集合[1,1,1,1,1,1,1,1,2,2],B集合[1,2,3,4,5,6,7,8,9,1]
显然A集合的熵值要低,因为A里面只有两种类别,相对稳定一些,而B中类别太多了,熵值就会大很多。(在分类任务中我们希望通过节点分支后数据类别的熵值大还是小呢?答案是越小越好)
熵:不确定性越大,得到的熵值也就越大
当p=0或p=1时,H§=0,随机变量完全没有不确定性;当p=0.5时,H§=1,此时随机变量的不确定性最大

如何决策一个节点的选择呢?
信息增益:表示特征X使得类Y的不确定性减少的程度。(分类后的专一性,希望分类后的结果是同类在一起)。例子:比如原来的熵值是10,那么通过分类之后熵值变成了8,那么信息增益就是10-8=2。所以节点的选择就是找信息增益最大的那一个。
决策树构造实例
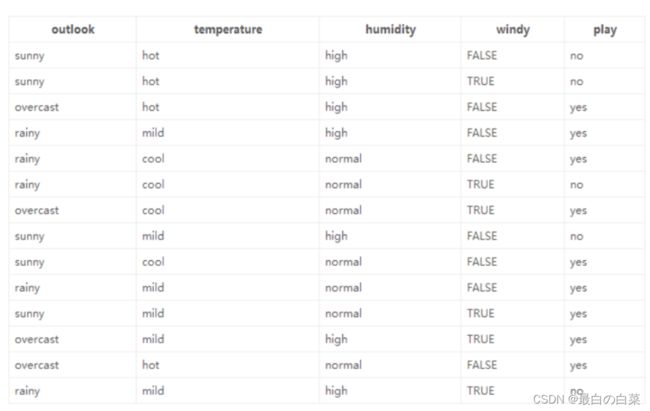
数据:14天打球情况;特征:4种环境变化;目标:构造决策树
划分方式:4种;问题:谁当根节点呢?依据:信息增益
在历史数据中(14天)有9天打球,5天不打球,所以此时的熵应为: − 9 14 log 2 9 14 − 5 14 log 2 5 14 = 0.940 -\frac{9}{14} \log _{2} \frac{9}{14}-\frac{5}{14} \log _{2} \frac{5}{14}=0.940 −149log2149−145log2145=0.940
4个特征逐一分析,先从outlook特征开始:
Outlook = sunny时,熵值为0.971
Outlook = overcast时,熵值为0
Outlook = rainy时,熵值为0.971
根据数据统计,outlook取值分别为sunny,overcast,rainy的概率分别为:5/14, 4/14, 5/14
熵值计算:5/14 * 0.971 + 4/14 * 0 + 5/14 * 0.971 = 0.693(gain(temperature)=0.029 gain(humidity)=0.152 gain(windy)=0.048)
信息增益:系统的熵值从原始的0.940下降到了0.693,增益为0.247
同样的方式可以计算出其他特征的信息增益,那么我们选择最大的那个就可以啦,相当于是遍历了一遍特征,找出来了大当家,然后再其余的中继续通过信息增益找二当家!
决策树算法分类
ID3算法:基于信息增益(有什么问题呢?可能会错把ID这样的稳定特征当做根节点。但ID对最终的结果并没有关联)
C4.5:信息增益率(用信息增益比上自身的熵值)(解决ID3问题,考虑自身熵)
CART:使用GINI系数来当做衡量标准
GINI系数: Gini ( p ) = ∑ k = 1 K p k ( 1 − p k ) = 1 − ∑ k = 1 K p k 2 \operatorname{Gini}(p)=\sum_{k=1}^{K} p_{k}\left(1-p_{k}\right)=1-\sum_{k=1}^{K} p_{k}^{2} Gini(p)=∑k=1Kpk(1−pk)=1−∑k=1Kpk2 (和熵的衡量标准类似,计算方式不相同)
连续值怎么办?
决策树剪枝策略
为什么要剪枝:决策树过拟合风险很大,理论上可以完全分得开数据(想象一下,如果树足够庞大,每个叶子节点不就一个数据了嘛)
剪枝策略:预剪枝,后剪枝
预剪枝:边建立决策树边进行剪枝的操作(更实用)
后剪枝:当建立完决策树后来进行剪枝操作
预剪枝:限制深度,叶子节点个数,叶子节点样本数,信息增益量等
后剪枝:通过一定的衡量标准 C α ( T ) = C ( T ) + α ⋅ ∣ T leaf ∣ C_{\alpha}(T)=C(T)+\alpha \cdot\left|T_{\text {leaf }}\right| Cα(T)=C(T)+α⋅∣Tleaf ∣ (叶子节点越多,损失越大)(C(T)就是样本数乘以gini系数)
决策树案例:使用sklearn构造决策树模型
%matplotlib inline

import matplotlib.pyplot as plt

import pandas as pd
# 导入内置数据集,房价
# 这个报错ModuleNotFoundError: No module named 'sklearn.datasets.california_housing’
# from sklearn.datasets.california_housing import fetch_california_housing
from sklearn.datasets import fetch_california_housing
housing = fetch_california_housing()
print(housing.DESCR)
… _california_housing_dataset:
California Housing dataset
Data Set Characteristics:
:Number of Instances: 20640
:Number of Attributes: 8 numeric, predictive attributes and the target
:Attribute Information:
- MedInc median income in block group
useAge median house age in block group- AveRooms average number of rooms per household
eBedrms average number of bedrooms per household- Population block group population
eOccup average number of household members- Latitude block group latitude
ngitude block group longitude
- Latitude block group latitude
- Population block group population
- AveRooms average number of rooms per household
:Missing Attribute Values: None
This dataset was obtained from the StatLib repository.
https://www.dcc.fc.up.pt/~ltorgo/Regression/cal_housing.html
The target variable is the median house value for California districts,
expressed in hundreds of thousands of dollars ($100,000).
This dataset was derived from the 1990 U.S. census, using one row per census
block group. A block group is the smallest geographical unit for which the U.S.
Census Bureau publishes sample data (a block group typically has a population
of 600 to 3,000 people).
An household is a group of people residing within a home. Since the average
number of rooms and bedrooms in this dataset are provided per household, these
columns may take surpinsingly large values for block groups with few households
and many empty houses, such as vacation resorts.
It can be downloaded/loaded using the
:func:sklearn.datasets.fetch_california_housing function.
… topic:: References
- Pace, R. Kelley and Ronald Barry, Sparse Spatial Autoregressions,
Statistics and Probability Letters, 33 (1997) 291-297
housing.data.shape
(20640, 8)
housing.data[0]
array([ 8.3252 , 41. , 6.98412698, 1.02380952,
322. , 2.55555556, 37.88 , -122.23 ])
from sklearn import tree
# 树的最大深度是2
dtr = tree.DecisionTreeRegressor(max_depth = 2)
# 所有数据第六列和第七列
dtr.fit(housing.data[:, [6, 7]], housing.target)
DecisionTreeRegressor(max_depth=2)
树模型参数:
-
1.criterion(衡量标准) gini or entropy
-
2.splitter best or random 前者是在所有特征中找最好的切分点 后者是在部分特征中(数据量大的时候)
-
3.max_features None(所有),log2,sqrt,N 特征小于50的时候一般使用所有的
-
4.max_depth 数据少或者特征少的时候可以不管这个值,如果模型样本量多,特征也多的情况下,可以尝试限制下
-
5.min_samples_split 如果某节点的样本数少于min_samples_split,则不会继续再尝试选择最优特征来进行划分如果样本量不大,不需要管这个值。如果样本量数量级非常大,则推荐增大这个值。
-
6.min_samples_leaf 这个值限制了叶子节点最少的样本数,如果某叶子节点数目小于样本数,则会和兄弟节点一起被剪枝,如果样本量不大,不需要管这个值,大些如10W可是尝试下5
-
7.min_weight_fraction_leaf 这个值限制了叶子节点所有样本权重和的最小值,如果小于这个值,则会和兄弟节点一起被剪枝默认是0,就是不考虑权重问题。一般来说,如果我们有较多样本有缺失值,或者分类树样本的分布类别偏差很大,就会引入样本权重,这时我们就要注意这个值了。
-
8.max_leaf_nodes 通过限制最大叶子节点数,可以防止过拟合,默认是"None”,即不限制最大的叶子节点数。如果加了限制,算法会建立在最大叶子节点数内最优的决策树。如果特征不多,可以不考虑这个值,但是如果特征分成多的话,可以加以限制具体的值可以通过交叉验证得到。
-
9.class_weight 指定样本各类别的的权重,主要是为了防止训练集某些类别的样本过多导致训练的决策树过于偏向这些类别。这里可以自己指定各个样本的权重如果使用“balanced”,则算法会自己计算权重,样本量少的类别所对应的样本权重会高。
-
10.min_impurity_split 这个值限制了决策树的增长,如果某节点的不纯度(基尼系数,信息增益,均方差,绝对差)小于这个阈值则该节点不再生成子节点。即为叶子节点 。
-
n_estimators:要建立树的个数
#要可视化显示 首先需要安装 graphviz   http://www.graphviz.org/Download..php
dot_data = \
    tree.export_graphviz(
        dtr,
        out_file = None,
        feature_names = housing.feature_names[6:8],
        filled = True,
        impurity = False,
        rounded = True
    )
#pip install pydotplus
import pydotplus
# import os
# 也可以将E:\PythonTools\graphviz\bin这个路径添加到系统变量
# os.environ["PATH"] += os.pathsep + 'E:\PythonTools\graphviz\bin'  #注意修改你的路径
graph = pydotplus.graph_from_dot_data(dot_data)
graph.get_nodes()[7].set_fillcolor("#FFF2DD")
from IPython.display import Image
Image(graph.create_png())
[外链图片转存失败,源站可能有防盗链机制,建议将图片保存下来直接上传(img-kPXma4en-1641892268292)(笔记图片/image-20220111170455426.png)]
graph.write_png("dtr_white_background.png")
True
# 演示模型的构造
from sklearn.model_selection import train_test_split
data_train, data_test, target_train, target_test = \
    train_test_split(housing.data, housing.target, test_size = 0.1, random_state = 42)
dtr = tree.DecisionTreeRegressor(random_state = 42)
dtr.fit(data_train, target_train)

dtr.score(data_test, target_test)
0.63569049103791
# 随机森林
from sklearn.ensemble import RandomForestRegressor
rfr = RandomForestRegressor( random_state = 42)
rfr.fit(data_train, target_train)
rfr.score(data_test, target_test)
0.8087175262588111
# 版本问题,这个报错
# from sklearn.grid_search import GridSearchCV
from sklearn.model_selection import GridSearchCV
# 字典的格式
tree_param_grid = { 'min_samples_split': list((3,6,9)),'n_estimators':list((10,50,100))}
# 第一个参数是选择算法;第三个参数是指进行几次交叉验证
grid = GridSearchCV(RandomForestRegressor(),param_grid=tree_param_grid, cv=5)
grid.fit(data_train, target_train)
# 第二个错误,grid_scores_改成cv_results_
grid.cv_results_, grid.best_params_, grid.best_score_
({‘mean_fit_time’: array([0.7521647 , 3.59998145, 7.16318746, 0.67934194, 3.19757972,
6.34081721, 0.60987587, 3.04001498, 6.18133183]),
‘std_fit_time’: array([0.01722412, 0.16825202, 0.09425605, 0.01060766, 0.04564452,
0.02400757, 0.00580197, 0.01219418, 0.18815727]),
‘mean_score_time’: array([0.0083776 , 0.04024372, 0.07755027, 0.00757804, 0.03277311,
0.06422324, 0.00679545, 0.02955985, 0.06144557]),
‘std_score_time’: array([0.00048848, 0.00314814, 0.00116292, 0.00049089, 0.00088657,
0.0008378 , 0.00040627, 0.00046795, 0.00227606]),
‘param_min_samples_split’: masked_array(data=[3, 3, 3, 6, 6, 6, 9, 9, 9],
mask=[False, False, False, False, False, False, False, False,
False],
fill_value=’?’,
dtype=object),
‘param_n_estimators’: masked_array(data=[10, 50, 100, 10, 50, 100, 10, 50, 100],
mask=[False, False, False, False, False, False, False, False,
False],
fill_value=’?’,
dtype=object),
‘params’: [{‘min_samples_split’: 3, ‘n_estimators’: 10},
{‘min_samples_split’: 3, ‘n_estimators’: 50},
{‘min_samples_split’: 3, ‘n_estimators’: 100},
{‘min_samples_split’: 6, ‘n_estimators’: 10},
{‘min_samples_split’: 6, ‘n_estimators’: 50},
{‘min_samples_split’: 6, ‘n_estimators’: 100},
{‘min_samples_split’: 9, ‘n_estimators’: 10},
{‘min_samples_split’: 9, ‘n_estimators’: 50},
{‘min_samples_split’: 9, ‘n_estimators’: 100}],
‘split0_test_score’: array([0.7880738 , 0.81106905, 0.81089976, 0.78852237, 0.80795057,
0.81003866, 0.7912159 , 0.80892862, 0.80829301]),
‘split1_test_score’: array([0.77690273, 0.79933923, 0.80203675, 0.77791111, 0.79547901,
0.80169207, 0.77375316, 0.79732657, 0.79970131]),
‘split2_test_score’: array([0.78866018, 0.79905259, 0.80293897, 0.78424279, 0.8009445 ,
0.80187861, 0.78869169, 0.79884363, 0.80415688]),
‘split3_test_score’: array([0.79474503, 0.80993589, 0.81217803, 0.7916471 , 0.80850096,
0.80937341, 0.79557417, 0.80967136, 0.8108149 ]),
‘split4_test_score’: array([0.7882208 , 0.80676804, 0.80722714, 0.79129583, 0.80694681,
0.81052347, 0.79328867, 0.80444095, 0.80714341]),
‘mean_test_score’: array([0.78732051, 0.80523296, 0.80705613, 0.78672384, 0.80396437,
0.80670124, 0.78850472, 0.80384223, 0.8060219 ]),
‘std_test_score’: array([0.00577627, 0.00512771, 0.00407877, 0.00514191, 0.00502964,
0.00403083, 0.00771826, 0.00505269, 0.0038162 ]),
‘rank_test_score’: array([8, 4, 1, 9, 5, 2, 7, 6, 3])},
{‘min_samples_split’: 3, ‘n_estimators’: 100},
0.8070561312706346)
rfr = RandomForestRegressor( min_samples_split=3,n_estimators = 100,random_state = 42)
rfr.fit(data_train, target_train)
rfr.score(data_test, target_test)
0.8100761636145944
pd.Series(rfr.feature_importances_, index = housing.feature_names).sort_values(ascending = False)
MedInc 0.524270
AveOccup 0.137895
Latitude 0.090699
Longitude 0.089251
HouseAge 0.053953
AveRooms 0.044531
Population 0.030331
AveBedrms 0.029070
dtype: float64
报错问题解决
ModuleNotFoundError: No module named 'sklearn.datasets.california_housing’
https://blog.csdn.net/weixin_43694742/article/details/121890454
InvocationException: GraphViz’s executables not found
https://blog.csdn.net/weixin_43694742/article/details/121890454 或者将E:\PythonTools\graphviz\bin这个路径添加到系统变量
ModuleNotFoundError: No module named 'sklearn.grid_search
https://blog.csdn.net/u012852847/article/details/84639213/
AttributeError: ‘GridSearchCV’ object has no attribute 'grid_scores_'
https://blog.csdn.net/weixin_40283816/article/details/83346098


