Matlab传统神经网络函数:Newff的使用方法记录
newff,已经过时,新函数feedforwardnet似乎可以分割training set和testing set,实验中不想要这个功能,所以暂时还是使用习惯的newff,等有时间再熟悉新函数。
newff因为更新过一次使用方法,所以有些的网上的资料中的方法十分过时,对学习造成影响。总结一下,在Matlab 2014a中目前的newff方法。
一. 在MATLAB中运用神经网络时主要分为三步:设计、训练、测试:
- 设计包括:
设计每层神经元数目(输入层,隐含层,输出层)
设定转移函数σ:(每一层的神经元基本上都会用同一个转移函数)
设定训练方法:traingdx(梯度下降)、trainlm(Levenburg-Marquardt,一种结合了梯度下降法和牛顿法的方法)
其他可选部分:误差函数(默认MSE),训练过程作图,等等。
1. 简单的例子
P = [0 1 2 3 4 5 6 7 8 9 10];%Training Patterns (domain values)
T = [0 1 2 3 4 3 2 1 2 3 4];%Training Targets (range values)
net = newff([0 10],[5 1],{’tansig’ ’purelin’});
%Plot the original data points and the untrained output
Y = sim(net,P);
figure(1)
plot(P,T,P,Y,’o’)
title(’Data and Untrained Network Output’)
%Train the network and plot the results
net.trainParam.goal=0.01; %0 is the default- too small!
net.trainParam.epochs = 50; %For our sample, don’t train toolong
net = train(net,P,T);
X = linspace(0,10); %New Domain Points
Y = sim(net,X); %Network Output
figure(2)
plot(P,T,’ko’,X,Y)
%An alternative way to test training: postreg
figure(3)
Tout=sim(net,P); %Get network output for the training domain
[m,b,r]=postreg(T,Tout); %Performs a linear regression
注意:
a.输入值最小值为0,最大值为10,这是通过newff第一个变量设定的。如果具有m个输入特征,此变量,需要变成m行。
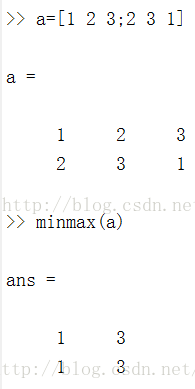
上面说了,newff第一个变量,用来设定输入特征的范围。有些人使用minmax来输入也可以,如下:
b. newff第二个变量,用来设定隐含层和输出层神经元的数目。第三个变量,设定转移函数:tansig(反正切),与默认的函数(sigmoidal)效果一样好。我们通常在输出层选择一个线性函数,所以我们选择(purelin)。
c. 默认训练方法为(Levenburg-Marquardt),为梯度下降和牛顿法的结合。
2. 中等的例子
此部分我们保留一部分验证集来对训练情况进行验证。
%创建训练集
p=[-1:0.05:1];
t=sin(2*pi*p)+0.1*randn(size(p));
%创建验证集
v.P=[-0.975:0.05:0.975];
v.T=[sin(2*pi*v.P)+0.1*randn(size(v.P))];
%创建神经网络,用验证集帮助停止训练,FeedForwardnet已经自带分隔训练集和验证集。
net=newff(minmax(p),[20,1]);
net.trainParam.show=25;
net.trainParam.epochs=300;
[net,tr]=train(net,p,t,[],[],v);
%画出数据和网络的输出
X=linspace(-1,1);
Y=sim(net,X);
plot(p,t,’k*’,v.P,v.T,’ko’,X,Y,’r-’);
legend(’TrainingData’,’Testing Data’,’Network’)
3. 复杂的例子:字符识别
为了运行次代码,开始要把下一页的函数:PlotLetter.m写出保存,这个函数用于可视化出来我们的字符。
[alphabet,targets]= prprob;  %在MatlAb中建立训练集
plotletters(alphabet); %用PlotLetter函数画出来训练集中的字符我们设计了隐藏层包括10个节点,而在输出层26个节点的神经网络,在隐藏层和输出层使用logsig转移函数。
算法训练:
net =newff(minmax(alphabet),[10 26],{’logsig’ ’logsig’},’traingdx’);
% 设置这些值,可以得到提供更好的训练结果(权重和偏置的初始化应该设置较小)
net.LW{2,1}= net.LW{2,1}*0.01;
net.b{2} =net.b{2}*0.01;
net.performFcn= ’sse’; % Sum-Squared Error performance function
net.trainParam.goal= 0.1; % Sum-squared error goal.
net.trainParam.show= 20; % Frequency of progress displays (in epochs).
net.trainParam.epochs= 5000; % Maximum number of epochs to train.
net.trainParam.mc= 0.95; % Momentum constant.
% 训练开始...请等待...
P =alphabet;
noisyP=alphabet+randn(size(alphabet))*0.4;
T =targets;
[net,tr] =train(net,P,T);
[net,tr] =train(net,noisyP,T);
%在噪声数据上测试
noisyP =alphabet+randn(size(alphabet)) * 0.2;
plotletters(noisyP);
A2 =sim(net,noisyP);
for j=1:26%Number of noisy letters
A3 =compet(A2(:,j));
answer(j)= find(compet(A3) == 1);
end
NetLetters=alphabet(:,answer);
plotletters(NetLetters);以下是plotletters.m函数,用来可视化字符
function   plotletters(alphabet)
fprintf(’plotlettersis plotting the first 25 letters\n’);
[m,n]=size(alphabet);
if m~=35
error(’plotlettersneeds columns 35 numbers long’);
end
figure
MM=colormap(gray);
MM=MM(end:-1:1,:);
colormap(MM);
nn=min([n,25]);
for j=1:nn
subplot(5,5,j)
imagesc(reshape(alphabet(:,j),5,7)’);
axis equal
axis off
end
