房屋价格预测
机器学习——房屋价格预测
点击链接查看文档代码
一.项目概述及计划
项目背景 :影响房屋价格的因素众多,如房屋面积、房屋层数、配套设施等等。
项目要求 :利用竞赛提供的数据,通过分析影响房屋价格的诸多因素来对房屋价格进行预测。
项目数据 :项目数据分成训练数据(train.txt)和测试数据(test.txt),其中字段” LotConfig”、“ LandSlope”等79个字段是特征变量(不包括ID和SalePrice列),”SalePrice”字段是目标变量。
评估指标 :本项目结果评估指标为均方误差(Mean Squared Error, MSE)。
该项目的基本思路如下图所示。项目所有流程均基于Python实现。
1:这是一个预测房价的项目,首先查看数据的行列情况,显示数据的信息,通过对数据进行分析,把训练集和测试集中NaN中占比高的列同时删除。
2:把数据中的列分为数值类型的列和分类类型的列,统计数据中数值类型和分类类型中包含NaN的列的数量。
3:然后针对空缺值进行处理
(1)第一种方法:只要该行中有空缺值就删除该行,发现留下的数据很少,该方法不可行。
(2)第二种方法:训练集和测试集中数值类型空缺值用中位数替代,分类类型空缺值用None替代。
4:对分类类型列进行LabelEncoding。举例:A, B, C, D, E --LabelEncoding–> 0, 1, 2, 3, 4。
5:把训练集中的数据构建成训练集和验证集。创建回归模型
(1):线性回归;
(2):K折交叉验证;
(3):随机森林;
(4):lightGBM;
(5):XGBoost;
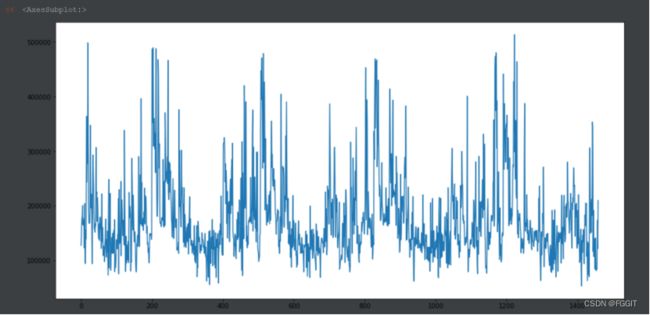
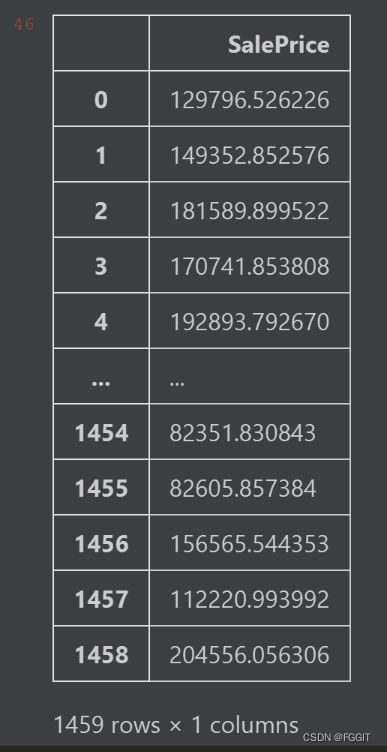
6:根据前面得到的预测误差值,选取lightGBM算法。通过训练集中建造年份、房屋面积等属性列来训练模型。然后对测试集进行测试,输出结果,把结果数据用图像显示出来,最后把结果保存在 LGBR_base_model.csv中。
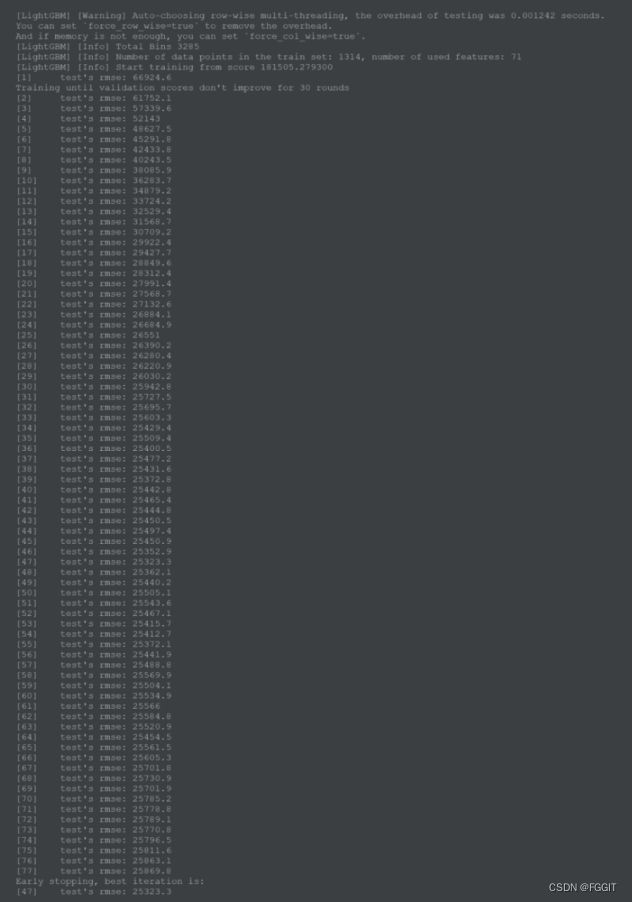
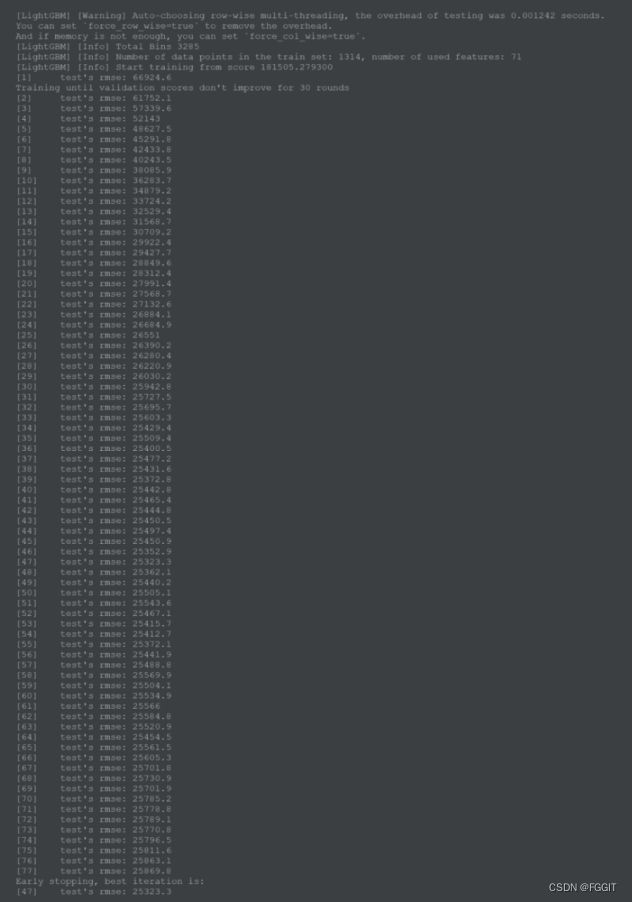
7:对lightGBM算法进行调参,通过训练集中建造年份、楼层面积等属性列来训练模型。然后对测试集进行测试,输出结果,把结果数据用图像显示出来,最后把结果保存在 LGBR_model2.csv中。
8:比较调参前和调参后的结果,发现两个结果的变化并不大,于是我猜测应该是训练数据量太少的原因。
二.问题描述
让购房者描述他们梦想中的房子,他们可能不会从地下室天花板的高度或与东西铁路的接近程度开始。 但是这个游乐场比赛的数据集证明,与卧室数量或白色栅栏相比,对价格谈判的影响要大得多。
凭借 79 个解释变量(几乎)描述了爱荷华州艾姆斯住宅的各个方面,这项竞赛挑战您预测每栋房屋的最终价格。
该项目要求利用给定的数据(共包括79个解释变量,数值型特征和类别型特征均有)来对房屋价格进行预测,因此考虑采用回归方法进行预测。同时,为了提高预测的准确率(尽量降低RMSE),考虑基于集成学习思想的多个回归模型集成方法。
三.模型建模
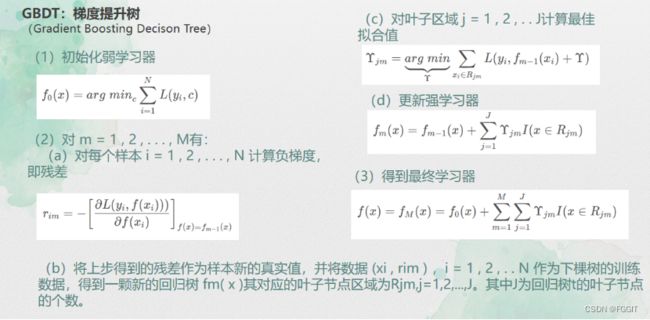
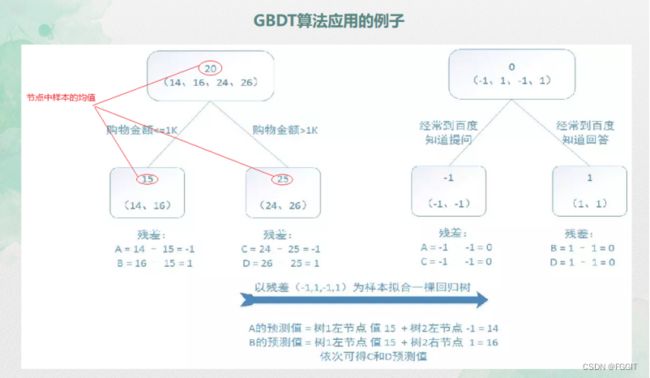
模型介绍:
超参调优:
1:算法建模、训练、验证
1-1:数据集分类
1-1-1:对分类类型列进行LabelEncoding,举例:A, B, C, D, E --LabelEncoding–> 0, 1, 2, 3, 4。
#%%
from sklearn.preprocessing import LabelEncoder
LE = LabelEncoder()
for col in category_columns:
    train[col] = LE.fit_transform(train[col])
    test[col] = LE.fit_transform(test[col])
#%%
1-1-2:把训练集中的数据构建成训练集和验证集。
#%%
# 说明:Id不是特征,SalePrice是标签,需要屏蔽
X = train.drop(columns=['Id', 'SalePrice'], axis=1).values
# 标签 SalePrice
y = train['SalePrice'].values
#%%
1-2:数据集分离
#%%
from sklearn.model_selection import train_test_split
X_train, X_test, y_train, y_test = train_test_split(X, y, test_size=0.3, shuffle=True) # 验证集占比30%,打乱顺序
#%%
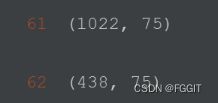
# 查看训练集中数据的行列情况
X_train.shape
#%%
# 查看验证集中数据的行列情况
X_test.shape
#%%
2:创建回归模型
2-1:线型回归
#%%
from sklearn.linear_model import LinearRegression
from sklearn.metrics import mean_absolute_error
'''
MSE: Mean Squared Error
均方误差是指参数估计值与参数真值之差平方的期望值;
MSE可以评价数据的变化程度,MSE的值越小,说明预测模型描述实验数据具有更好的精确度。
'''
LR = LinearRegression()
# 训练
LR.fit(X_train, y_train)
# 预测
y_pred = LR.predict(X_test)
# 将预测的房屋价格值和真实的房屋价格值传入MSE评估指标方法中,得到MSE
print(f'Root Mean Squared Error : {np.sqrt(mean_absolute_error(np.log(y_test), np.log(y_pred)))}')
#%%
2-2:K折交叉验证
#%%
from sklearn.model_selection import KFold
# 10折
kf = KFold(n_splits=10)
# 用来保存10折运行的结果
rmse_scores = []
# 分割元数据,生成索引
for train_indices, test_indices in kf.split(X):
    # 训练集和验证集
    X_train, X_test = X[train_indices], X[test_indices]
    # 训练标签集和验证标签集
    y_train, y_test = y[train_indices], y[test_indices]
    # 初始化线性回归模型对象
    LR = LinearRegression(normalize=True)
    # 训练
    LR.fit(X_train, y_train)
    # 预测
    y_pred = LR.predict(X_test)
    # 评估
    rmse = np.sqrt(mean_absolute_error(np.log(y_test), np.log(abs(y_pred))))
    # 累计每一轮的验证结果
    rmse_scores.append(rmse)
# 得到10组均方根误差
print("rmse scores : ", rmse_scores)
# 得到均方根误差平均值
print(f'average rmse score : {np.mean(rmse_scores)}')
#%%
![]()
2-3:随机森林
#%%
from sklearn.ensemble import RandomForestRegressor
# K折交叉验证
kf = KFold(n_splits=10)
# 用来保存10折运行的结果
rmse_scores = []
for train_indices, test_indices in kf.split(X):
    X_train, X_test = X[train_indices], X[test_indices]
    y_train, y_test = y[train_indices], y[test_indices]
    # 初始化模型
    RFR = RandomForestRegressor() # 基模型
    # 训练/fit拟合
    RFR.fit(X_train, y_train)
    # 预测
    y_pred = RFR.predict(X_test)
    # 评估
    rmse = mean_absolute_error(y_test, y_pred)
    # 累计结果
    rmse_scores.append(rmse)
# 得到10组均方根误差
print("rmse scores : ", rmse_scores)
# 得到均方根误差平均值
print(f'average rmse scores : {np.mean(rmse_scores)}')
#%%
![]()
2-4:lightGBM
#%%
import lightgbm as lgb
# K折交叉验证
kf = KFold(n_splits=10)
# 用来保存10折运行的结果
rmse_scores = []
for train_indices, test_indices in kf.split(X):
    X_train, X_test = X[train_indices], X[test_indices]
    y_train, y_test = y[train_indices], y[test_indices]
    # 初始化模型
    LGBR = lgb.LGBMRegressor() # 基模型
    # 训练/fit拟合
    LGBR.fit(X_train, y_train)
    # 预测
    y_pred = LGBR.predict(X_test)
    # 评估
    rmse = mean_absolute_error(y_test, y_pred)
    # 累计结果
    rmse_scores.append(rmse)
# 得到10组均方根误差
print("rmse scores : ", rmse_scores)
# 得到10组均方根误差平均值
print(f'average rmse scores : {np.mean(rmse_scores)}')
#%%
![]()
2-5:XGBoost
#%%
import xgboost as xgb
# K折交叉验证
kf = KFold(n_splits=10)
# 用来保存10折运行的结果
rmse_scores = []
for train_indices, test_indices in kf.split(X):
    X_train, X_test = X[train_indices], X[test_indices]
    y_train, y_test = y[train_indices], y[test_indices]
    # 初始化模型
    XGBR = xgb.XGBRegressor() # 基模型
    # 训练/fit拟合
    XGBR.fit(X_train, y_train)
    # 预测
    y_pred = XGBR.predict(X_test)
    # 评估
    rmse = mean_absolute_error(y_test, y_pred)
    # 累计结果
    rmse_scores.append(rmse)
# 得到10组均方根误差
print("rmse scores : ", rmse_scores)
# 得到10组均方根误差平均值
print(f'average rmse scores : {np.mean(rmse_scores)}')
#%%
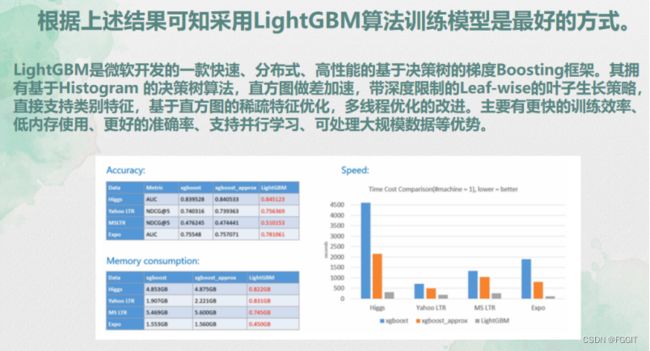
![]() 根据上述结果可知采用lightGBM算法训练模型是最好的方式。
根据上述结果可知采用lightGBM算法训练模型是最好的方式。
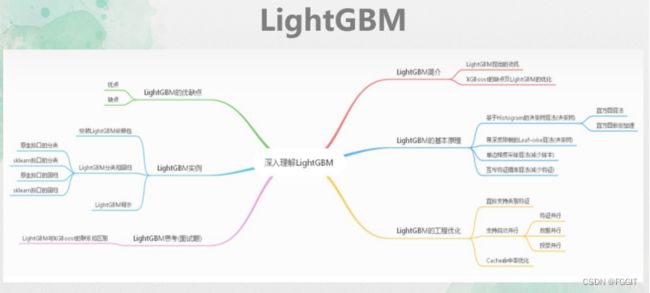
LightGBM是微软开发的一款快速、分布式、高性能的基于决策树的梯度Boosting框架。其拥有基于Histogram 的决策树算法,直方图做差加速,带深度限制的Leaf-wise的叶子生长策略,直接支持类别特征,基于直方图的稀疏特征优化,多线程优化的改进。主要有更快的训练效率、低内存使用、更好的准确率、支持并行学习、可处理大规模数据等优势。
3:模型预测
#%%
# 测试集的行列数
test.shape
#%%
# 显示测试集数据,没标明默认显示前5行数据
test.head()
#%%
# 根据前面的预测结果,选取lightGBM算法,在整个数据集上训练
LGBR.fit(X, y)
# 测试集中Id并不是特征,这里需要删除,然后开始训练
test_pred = LGBR.predict(test.drop('Id',axis=1).values)
#%%
# 创建一个只有一列为一列为SalePrice的DataFrame型数据result_df
result_df = pd.DataFrame(columns=['SalePrice'])
# 把刚刚训练得到的数据放到result_df中
result_df['SalePrice'] = test_pred
# 把数据导出到LGBR_base_model.csv中
result_df.to_csv('LGBR_base_model.csv', index=None, header=True)
#%%
# 显示result_df中的数据
result_df
#%%
# 用图表示result_df中的数据
result_df['SalePrice'].plot(figsize=(16,8))
#%%
4:lightGBM算法调参
#%%
train_data = lgb.Dataset(X_train, label=y_train) # 训练集
test_data = lgb.Dataset(X_test, label=y_test, reference=train_data) # 验证集
#%%
# 参数
params = {
    'objective':'regression', # 目标任务
    'metric':'rmse', # 评估指标
    'learning_rate':0.1, # 学习率
    'max_depth':15, # 树的深度
    'num_leaves':20, # 叶子数
}
# 创建模型对象
model = lgb.train(params=params,
                  train_set=train_data,
                  num_boost_round=300,
                  early_stopping_rounds=30,
                  valid_names=['test'],
                  valid_sets=[test_data])
#%%
# 最后一次为MES最小的值score
score = model.best_score['test']['rmse']
# 输出score
score
#%%
# 测试集中Id并不是特征,这里需要删除,然后开始训练
test_pred = model.predict(test.drop('Id',axis=1).values)
#%%
# 创建一个只有一列为一列为SalePrice的DataFrame型数据result_df2
result_df2 = pd.DataFrame(columns=['SalePrice'])
# 把刚刚训练得到的数据放到result_df2中
result_df2['SalePrice'] = test_pred
# 把数据导出到LGBR_model2.csv中
result_df2.to_csv('LGBR_model2.csv', index=None, header=True)
#%%
# 用图表示result_df2中的数据,
result_df2['SalePrice'].plot(figsize=(16,8))
#%%
四.实验分析
4.1 数据分析
(1):读取数据集
#%%
# 读取数据集
train = pd.read_csv("train.csv")
test = pd.read_csv("test.csv")
#%%
(2):查看数据的行列情况
#%%
# 查看训练集数据的行列情况
train.shape
#%%
# 查看测试集数据的行列情况
test.shape
#%%
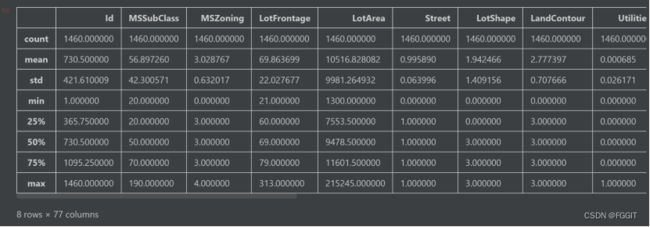
(3):显示训练集数据的信息和显示训练集数据描述
#%%
# 显示训练集数据的信息
train.info()
#%%
# 数据描述
train.describe()
#%%
#%%
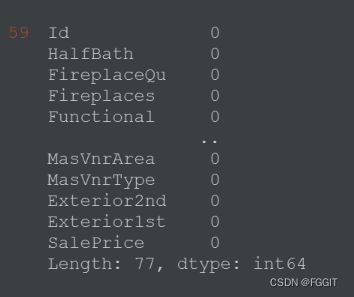
# 统计训练集每一列NaN的数量
train.isnull().sum().sort_values(ascending=False)
#%%
# 训练集每一列中,NaN所占比例
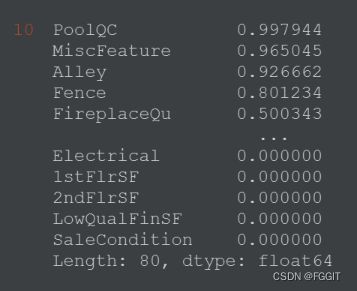
train.isnull().sum().sort_values(ascending=False) / train.shape[0]
#%%
# 测试集每一列中,NaN所占比例
test.isnull().sum().sort_values(ascending=False) / test.shape[0]
#%%
# 将训练集和测试集中 PoolQC,MiscFeature,Alley,Fence 列删除
train.drop(columns=['PoolQC','MiscFeature','Alley','Fence'], axis=1, inplace=True)
test.drop(columns=['PoolQC','MiscFeature','Alley','Fence'], axis=1, inplace=True)
#%%
(5):统计数据的数值类型的列和分类类型的列,并输出两种列的数量
#%%
# 统计train,test所有列中的:数值类型的列和分类类型的列
number_columns = [ col for col in train.columns if train[col].dtype != 'object']
category_columns = [col for col in train.columns if train[col].dtype == 'object']
#%%
# 数值类型的列的数量
len(number_columns)
#%%
# 分类类型的列的数量
len(category_columns)
#%%
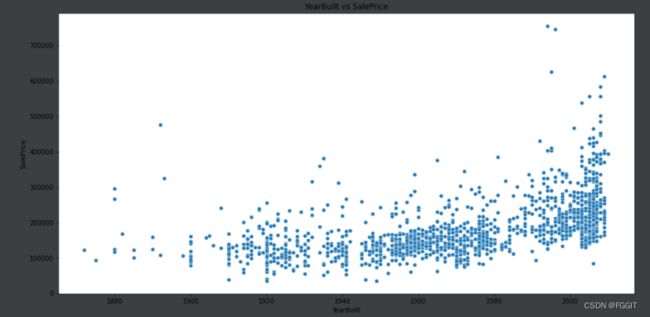
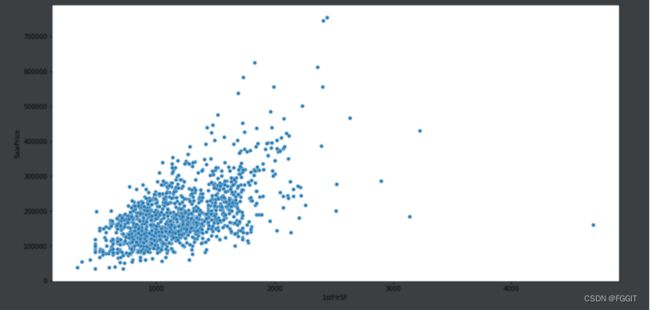
(6):用图形显示数值类型列的数据分布并分别绘制建造年份、楼层面积与售价之间的关系图
#%%
# 绘制显示数值类型列的数据分布
fig, axes = plt.subplots(nrows=13, ncols=3, figsize=(20, 18))
axes = axes.flatten()
for i, col in zip(range(len(number_columns)), number_columns):
    sns.distplot(train[col], ax=axes[i])
    plt.tight_layout()
#%%
# 建造年份YearBuilt与售价SalePrice 的关系
plt.figure(figsize=(16, 8)) # 画布大小
plt.title("YearBuilt vs SalePrice")
sns.scatterplot(train.YearBuilt, train.SalePrice)
plt.show()
#%%
# 楼层面积1stFlrSF与售价SalePrice 的关系
plt.figure(figsize=(16, 8))
sns.scatterplot(x='1stFlrSF', y='SalePrice', data=train)
plt.show()
#%%
(7):通过箱线图绘制数据较为离散的特征
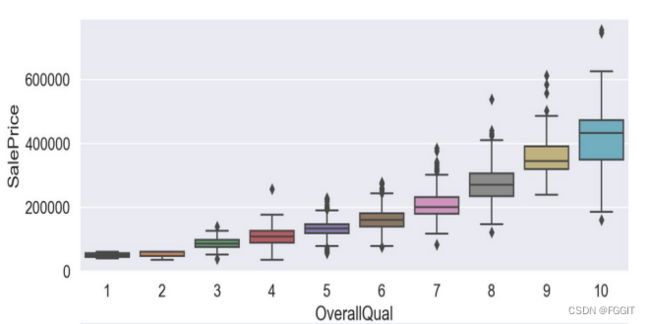
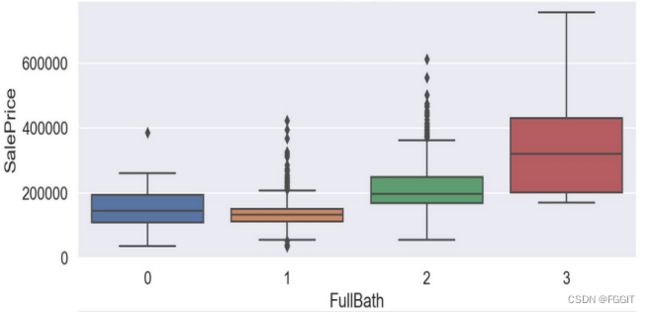
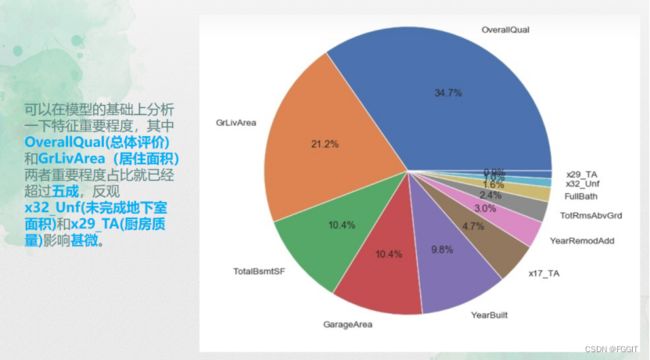
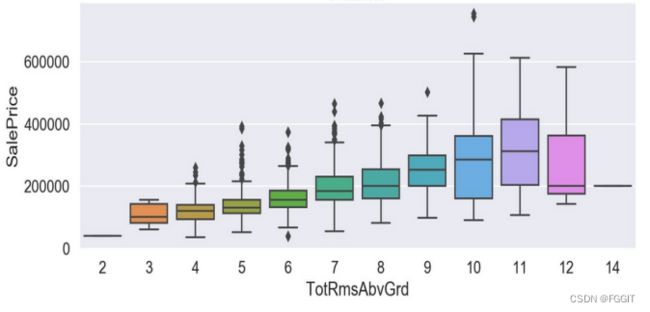 根据图形结果分析可得,verallQual(总体评价)对于价格的影响真的巨大,所以买卖口碑真的是非常重要,其他离散特征与目标变量间的联系也是具有很明显的趋势的。
(8):绘制分类类型列的数据分布图
#%%
# 绘制显示分类类型列的数据分布
fig, axes = plt.subplots(13, 3, figsize=(25, 20))
axes = axes.flatten()
for i, col in enumerate(category_columns):
    sns.stripplot(x=col, y='SalePrice', data=train, ax=axes[i])
plt.tight_layout()
plt.show()
#%%
(9):统计训练集中有哪些列包含NaN,输出训练集中数据类型和分类类型中包含NaN的列的数量
#%%
# 统计训练集中有哪些列包含NaN
train_nan_num = [] # train中数值类型包含NaN的列
train_nan_cat = [] # train中分类类型包含NaN的列
for col in number_columns:
    if train[col].isnull().sum() > 0:
        train_nan_num.append(col)
for col in category_columns:
    if train[col].isnull().sum() > 0:
        train_nan_cat.append(col)
#%%
# 训练集中数值类型包含NaN的列的数量
len(train_nan_num)
#%%
# 训练集中分类类型包含NaN的列的数量
len(train_nan_cat)
#%%
(10):统计测试集中有哪些列包含NaN,输出测试集中数据类型和分类类型中包含NaN的列的数量
#%%
# 统计测试集中有哪些列包含NaN
test_nan_num = [] # test中数值类型的列
test_nan_cat = [] # test中分类类型的列
# 注意:需要将SalePrice清理,因为test中没有SalePrice
number_columns.remove('SalePrice')
for col in number_columns:
    if test[col].isnull().sum() > 0:
        test_nan_num.append(col)
for col in category_columns:
    if test[col].isnull().sum() > 0:
        test_nan_cat.append(col)
#%%
# 测试集中数值类型包含NaN的列的数量
len(test_nan_num)
#%%
# 测试集中分类类型包含NaN的列的数量
len(test_nan_cat)
#%%
(11):针对数据中有NaN的情况
方法(1):简单粗暴:直接删除
#%%
# 只要该行中有空缺值就删除该行,发现留下的数据很少,该方法不可行
train_one = train.dropna(axis=0)
test_one = test.dropna(axis=0)
print(train_one.shape)
print(test_one.shape)
#%%
方法(2):折中法:对于数值类型列,取中位数;对于分类类型列,取None
#%%
# 训练集中数值类型空缺值用中位数替代,分类类型空缺值永None替代
for col in train_nan_num:
    train[col].fillna(train[col].median(), inplace=True)
for col in train_nan_cat:
    train[col].fillna('None', inplace=True)
#%%
#%%
# 测试集中数值类型空缺值用中位数替代,分类类型空缺值用None替代
for col in test_nan_num:
    test[col].fillna(test[col].median(), inplace=True) # 中位数
for col in test_nan_cat:
    test[col].fillna('None', inplace=True)
#%%
4.2 实验环境
Windows 10
PyCharm 2019.2.5
Python 3.8.1
Anaconda3
Jdk1.8
4.3 实验结果
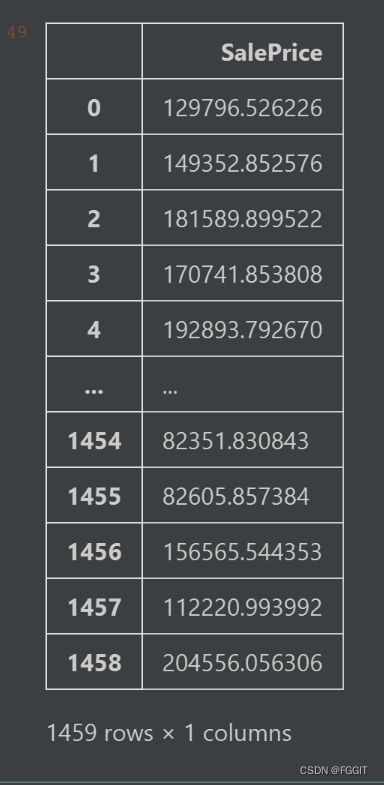
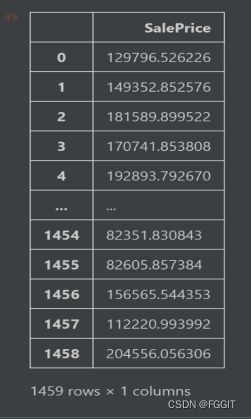
1:选取lightGBM算法,通过训练集中建造年份、房屋面积等属性列来训练模型。对测试集进行测试得到的结果为:
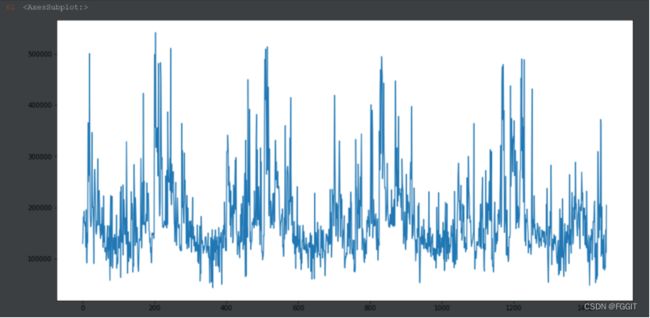
2:对lightGBM算法进行调参后,通过训练集中建造年份、房屋面积等属性列来训练模型。对测试集进行测试得到的结果为:
3:比较调参前和调参后的结果,发现两个结果的变化并不大,于是我猜测应该是训练数据量太少的原因。


