Matlab - MATLAB可视化/画图技巧(持续更新)
前言
此文章会涉及常用的画图函数和技巧,包括1维/2维/3维数据。 文章会一直更新。
2维图片
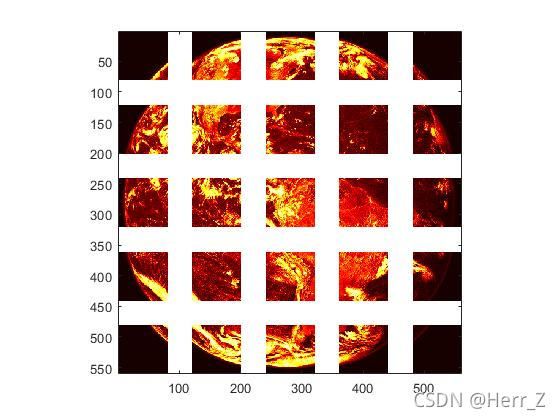
图像分割成不同的patches
27.08.2021
最近在尝试ViT模型,在可视化输入数据时需要把图片分割成若干部分(patches)。示例图片如下,
代码如下:
%% load image
uiopen(' earth.jpeg',1)
earth_gray = rgb2gray(earth);	% 转换成灰度图片
figure;imagesc(earth_gray)
whos earth_gray
%% cutout 	剪切
earth_gray_cutout = earth_gray;
earth_gray_cutout(1:30,:) = [];
earth_gray_cutout(end-10:end,:) = [];
earth_gray_cutout(:,1:50) = [];
earth_gray_cutout(:,end-20: end) = [];
figure;imagesc(earth_gray_cutout)
whos earth_gray_cutout

%% resize 大小变成 400 X 400
image_size = 400;
earth_gray_cutout_resize = imresize(earth_gray_cutout,[image_size image_size]);

%% divide the image into several patches
template_image = earth_gray_cutout_resize;

patch_size_given = 40;	% 每一部分的尺寸, 40个像素
number_of_patchs = image_size / patch_size_given;

padding_width = patch_size_given/2;	% 相邻部分的间距

template_patchs = ones(image_size+ (number_of_patchs-1)*padding_width, image_size+ (number_of_patchs -1)*padding_width)*255;	% 设置成255,是因为在hot中, 白色为最高值 (255)
figure;
for index_patch_1 = 1:number_of_patchs
    for index_patch_2 = 1:number_of_patchs
    patch_pickup = template_image(1 + (index_patch_1-1) * patch_size_given : index_patch_1*patch_size_given,...
        1 + (index_patch_2-1) * patch_size_given : index_patch_2*patch_size_given);
    template_patchs(1+(index_patch_1-1)*(patch_size_given + padding_width):index_patch_1*(patch_size_given)+(index_patch_1-1)*padding_width,...
        1+(index_patch_2-1)*(patch_size_given + padding_width):index_patch_2*(patch_size_given)+(index_patch_2-1)*padding_width) = patch_pickup;

    imagesc(template_patchs); colormap hot; axis image
    pause(0.02)
    end
end
结果如下

可以看到,图片已经被”分割“好了,但是坐标轴和刻度却影响了整体的效果。下面的代码可以去除不需要的信息。
% 移除坐标轴刻度和边框
set(gca,'Visible','off');	% 包括title

% 还有一种做法,可以保留title
set(gca,'XColor', 'none','YColor','none')
1维数据
柱状图 histogram
在分析数据分布式,常常会用到树状图histogram。当需要对比不同的数据时,如果能同时画出两个或者更多个树状图,那么就可以进行非常直观的对比。
这里需要用到一个第三方函数brewermap
map = brewermap(2, 'Set1');	% 一系列颜色
data1 =rand(100000,1);
data2 =rand(100000,1)*0.5;
data3 = rand(100000,1)*1.5;
figure;
histogram(data1,'facecolor',map(1,:),'facealpha',.5,'edgecolor','none')
hold on
histogram(data2,'facecolor',map(2,:),'facealpha',.5,'edgecolor','none')
hold on
histogram(data3,'facecolor',map(3,:),'facealpha',.5,'edgecolor','none')

box off
axis tight
% legalpha('H1','H2','H3','location','northeast')
legend('A','B','C')
legend boxoff

