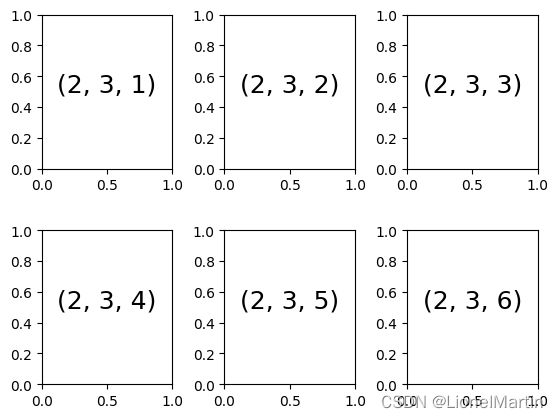
基础图表
1 曲线图和点状图
import numpy as np
import matplotlib.pyplot as plt
x = np.linspace(0, 10, 30)
plt.plot(x, np.sin(x), '-o')
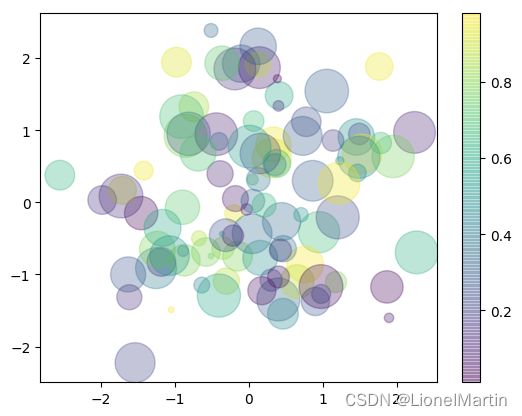
rng = np.random.RandomState(0)
x = rng.randn(100)
y = rng.randn(100)
colors = rng.rand(100)
sizes = 1000 * rng.rand(100)
plt.scatter(x, y,
c=colors,
s=sizes,
alpha=0.3,
cmap="viridis")
plt.colorbar()
.scatter(
x: 指定x轴数据
y: 指定y轴数据
s:指定散点的大小
c:指定散点的颜色
alpha:指定散点的透明度
linewidths:指定散点边框线的宽度
edgecolors:指定散点边框的颜色
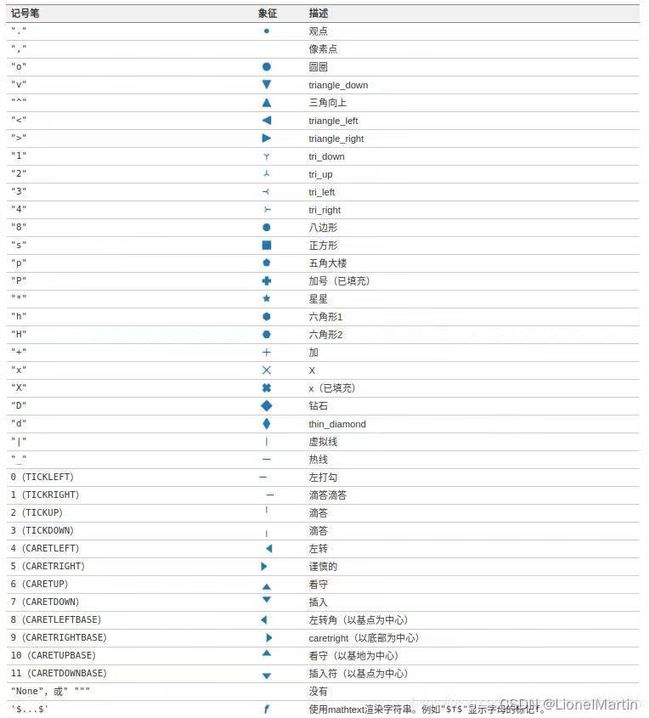
marker:指定散点的图形样式(支持的参数如下:表)
cmap:指定散点的颜色映射,会适应不同的颜色来区分散点的值
)
| marker |
支持的样式 |
. |
点标记 |
, |
像素标记 |
o |
圆形标记 |
v |
下三角形标记 |
^ |
上三角形标记 |
1 |
向下三叉标记 |
2 |
向上三叉标记 |
3 |
向左三叉标记 |
4 |
向右三叉标记 |
s |
正方形标记 |
p |
五角星标记 |
* |
星形标记 |
h |
八边形标记 |
H |
第二种八边形标记 |
+ |
加号标记 |
x |
x标记 |
D |
菱形标记 |
d |
尖菱形标记 |
I |
竖线标记 |
_ |
横线标记 |
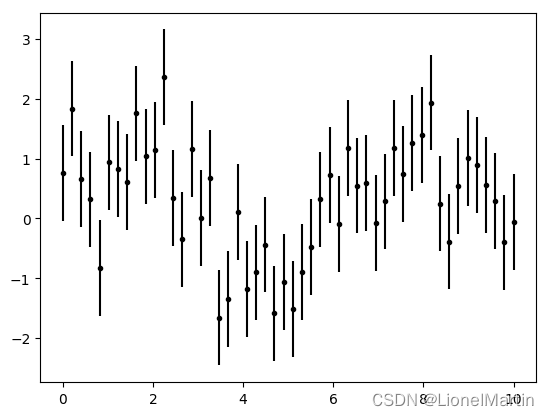
2 误差图
import numpy as np
import matplotlib.pyplot as plt
x = np.linspace(0,10,50)
dy = 0.8
y = np.sin(x)+dy*np.random.randn(50)
plt.errorbar(x,y,yerr=dy, fmt='.k')
plt.errorbar(
x,
y,
yerr,
xerr,
fmt,
ecolor,
elinewidth,
capsize,
capthick,
alpha,
marker,
markersize(简写ms),
markeredgecolor(简写mec),
markeredgewidth(简写mew),
markerfacecolor(简写mfc),
linestyle,
label,
)
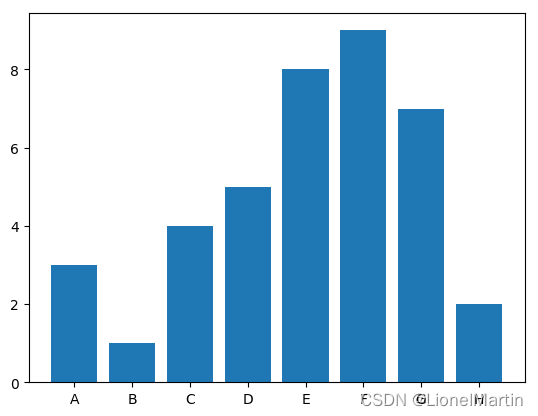
3 柱状图(直方图)
import numpy as np
import matplotlib.pyplot as plt
x= [1,2,3,4,5,6,7,8]
y = [3,1,4,5,8,9,7,2]
label = ['A','B','C','D','E','F','G','H']
plt.bar(x,y,tick_label = label)
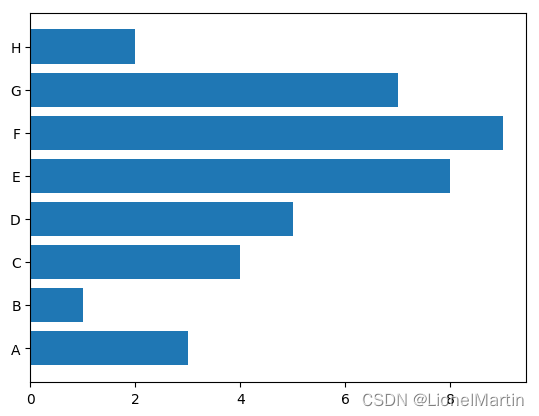
plt.barh(x, y, tick_label = label)
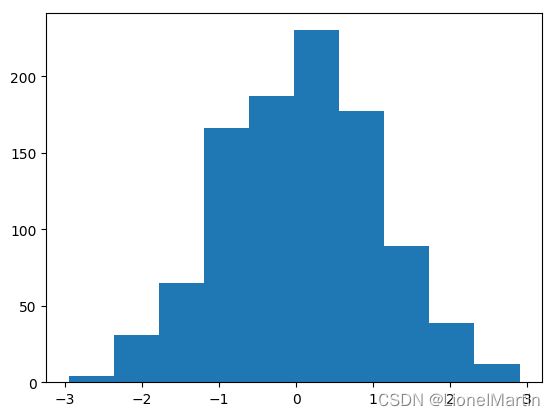
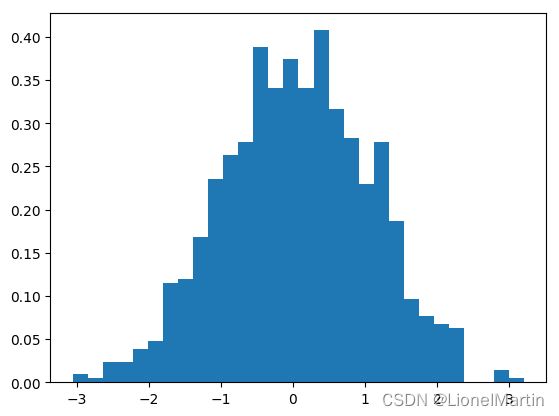
data = np.random.randn(1000)
plt.hist(data)
plt.hist(data, bins=30, histtype='stepfilled', density=True)
plt.show()
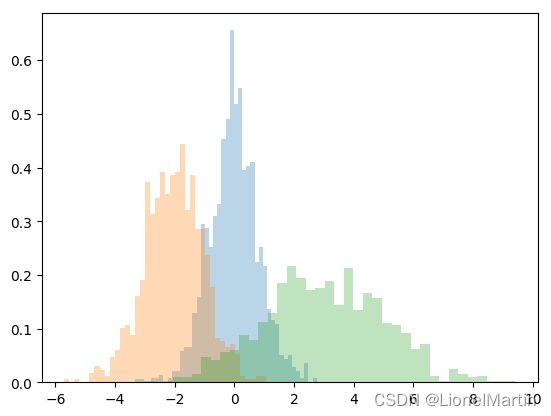
x1 = np.random.normal(0,0.8,1000)
x2 = np.random.normal(-2, 1, 1000)
x3 = np.random.normal(3, 2, 1000)
kwags = dict(alpha=0.3, bins=40,density = True)
plt.hist(x1, **kwags)
plt.hist(x2, **kwags)
plt.hist(x3, **kwags)
4 自定义曲线图像
import numpy as np
import matplotlib.pyplot as plt
x = np.linspace(0,10,100)
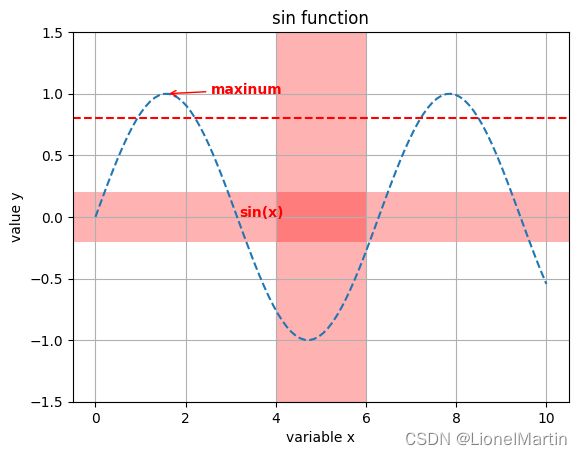
plt.plot(x,np.sin(x), '--', label='sin(x)')
plt.xlabel('variable x')
plt.ylabel('value y')
plt.title('sin function')
plt.grid()
plt.axhline(y=0.8, ls = '--',c='r')
plt.axvspan(xmin=4, xmax=6, facecolor='r',alpha=0.3)
plt.axhspan(ymin=-0.2, ymax=0.2, facecolor='r',alpha=0.3)
plt.text(3.2, 0, 'sin(x)', weight='bold', color='r')
plt.annotate('maxinum', xy=(np.pi/2, 1), xytext=(np.pi/2+1, 1),
weight='bold',
color='r',
arrowprops=dict(
arrowstyle='->',
connectionstyle='arc3',color='r'))
plt.ylim(-1.5, 1.5)
plt.show()
5 自定义图例
import numpy as np
import matplotlib.pyplot as plt
x = np.linspace(0,10,1000)
flg, ax = plt.subplots()
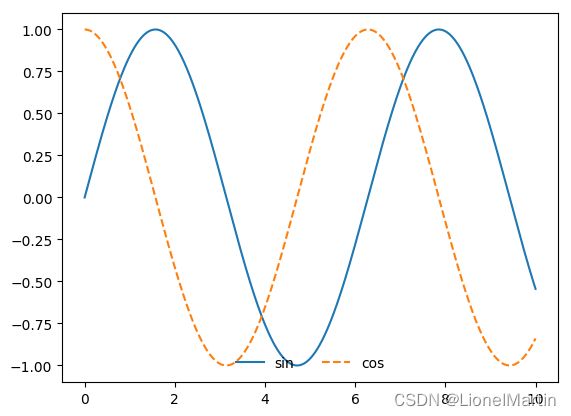
ax.plot(x, np.sin(x), label='sin')
ax.plot(x, np.cos(x), '--',label='cos')
ax.legend()
ax.legend(loc='upper left', frameon=False)
ax.legend(frameon=False, loc='lower center', ncol=2)
plt.show()
import numpy as np
import matplotlib.pyplot as plt
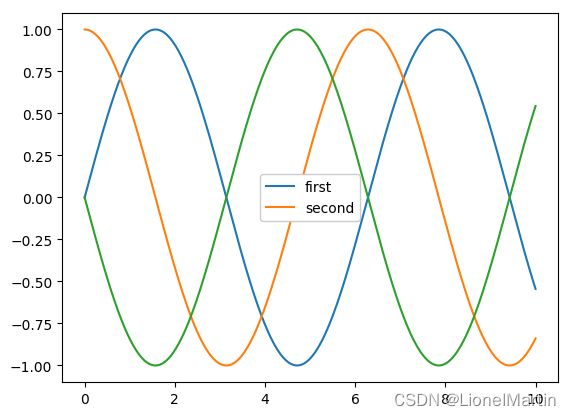
plt.plot(x, y[:,0], label='first')
plt.plot(x, y[:,1], label='second')
plt.plot(x, y[:,2],)
plt.legend(framealpha=1, frameon=True)
import numpy as np
import matplotlib.pyplot as plt
fig, ax = plt.subplots()
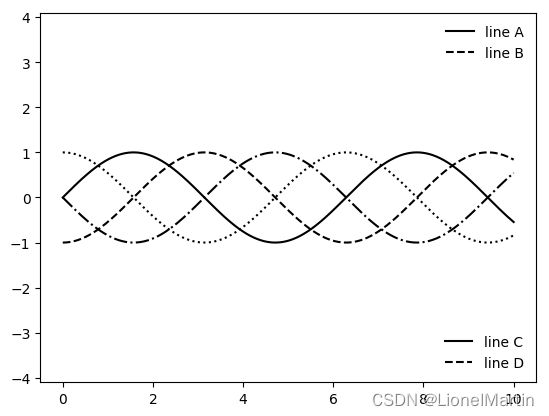
lines = []
styles = ['-','--', '-.', ':']
x = np.linspace(0, 10, 1000)
for i in range(4):
lines += ax.plot(x, np.sin(x-i*np.pi/2), styles[i], color='black')
ax.axis('equal')
ax.legend(lines[:2], ['line A', 'line B'],loc='upper right', frameon=False)
from matplotlib.legend import Legend
leg = Legend(ax, lines[:2], ['line C', 'line D'], loc='lower right', frameon=False)
ax.add_artist(leg)
6 多子图
import numpy as np
import matplotlib.pyplot as plt
ax1 = plt.axes()
ax2 = plt.axes([0.65, 0.65, 0.2, 0.2])
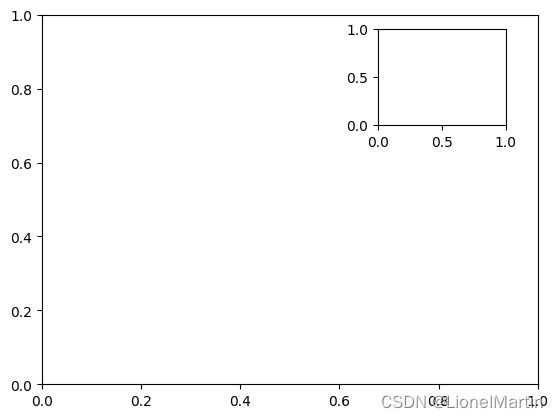
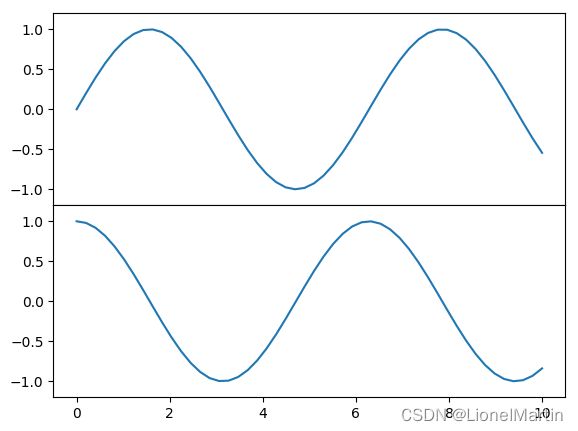
fig = plt.figure()
ax1 = fig.add_axes([0.1,0.5, 0.8, 0.4],ylim=(-1.2, 1.2))
ax2 = fig.add_axes([0.1,0.1, 0.8, 0.4], ylim=(-1.2, 1.2))
x = np.linspace(0,10)
ax1.plot(x, np.sin(x))
ax2.plot(x, np.cos(x))
import numpy as np
import matplotlib.pyplot as plt
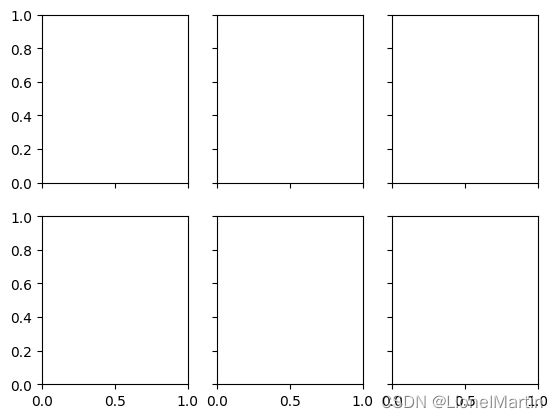
fig, ax = plt.subplots(2,3,sharex='col',sharey='row')
