吴恩达机器学习课后习题ex2(续)
ex2: Regularized logistic regression
import numpy as np
import matplotlib.pyplot as plt
import pandas as pd
from sklearn import linear_model
import scipy.optimize as opt
from sklearn.metrics import classification_report
def raw_data(path):
    data = pd.read_csv(path,names=['test1','test2','accept'])
    return data
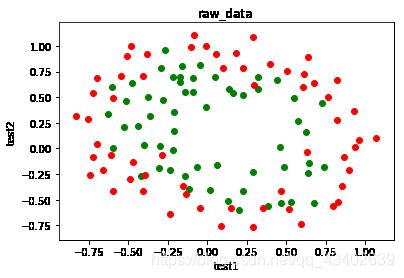
def draw_data(data):
    accept = data[data.accept == 1]#合格
    reject = data[data.accept == 0]#不合格
    plt.scatter(accept.test1,accept.test2,c='g',label = 'qualified')
    plt.scatter(reject.test1,reject.test2,c='r',label = 'not qualified')
    plt.title('raw_data')
    plt.xlabel('test1')
    plt.ylabel('test2')
    return plt
特征映射参考资料:
https://www.zhihu.com/question/65020904
def feature_mapping(x1,x2,power):
    datamap = {}
    for i in range(power+1):
        for j in range(i+1):
            datamap['f{}{}'.format(j,i-j)] = np.power(x1,j)*np.power(x2,i-j)
            #产生x1,x2的多项式
    return pd.DataFrame(datamap)

def sigmoid(z):
    return 1/(1+np.exp(-z))
numpy与pandas数据格式详细介绍(含pd.DataFrame)
https://zhuanlan.zhihu.com/p/35592464
#正则化代价函数
def regularized_cost_function(theta,x,y,lam):
    m = x.shape[0]#总例数
    j = (y.dot(np.log(sigmoid(x.dot(theta))))+(1-y).dot(np.log(1-sigmoid(x.dot(theta)))))/(-m)
    #加上惩罚项
    penalty = lam*(theta.dot(theta))/(2*m)
    return j+penalty
#计算偏导数
def regularized_gradient_descent(theta,x,y,lam):
    m = x.shape[0]
    partial_j = ((sigmoid(x.dot(theta))-y).T).dot(x)/m
    partial_penalty = lam*theta/m
    partial_penalty[0] = 0 #第一项不惩罚
    return partial_j+partial_penalty
def predict(theta,x):
    h = x.dot(theta)
    return [1 if x >= 0.5 else 0 for x in h]
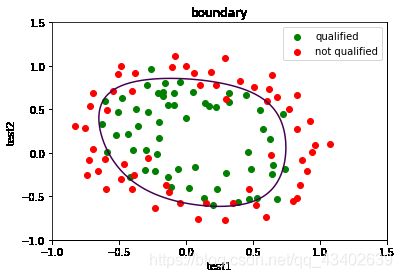
#确定边界线
def boundary(theta,data,x,y):
    [X,Y] = np.meshgrid(x,y)
    x = np.linspace(-1,1.5,200)
    x1, x2 = np.meshgrid(x,x) #???
    z = feature_mapping(x1.ravel(),x2.ravel(),6).values
    z = z.dot(theta)
    z = z.reshape(x1.shape)
    plt = draw_data(data)
    plt.contour(x1,x2,z,0)
    plt.title('boundary')
    plt.legend(loc=0)
    plt.show()
numpy.meshgrid()理解
https://blog.csdn.net/lllxxq141592654/article/details/81532855
https://mp.weixin.qq.com/s?src=11×tamp=1562830720&ver=1721&signature=G*zsqj91mOIJlkmVRbOPLVtwWhRlWC5nDNkl6ER*OVIwJouILIY-3lbOQVRJ4sBXMpIKadps89EEvvhHCdMeU1PcbtLiQ1ATe*emOK3She2najTzQ04m97vjf6Lo4ak3&new=1
numpy 中的reshape,flatten,ravel 数据平展,多维数组变成一维数组
https://www.cnblogs.com/onemorepoint/p/9551762.html
def main():
    rawdata = raw_data('ex2data2.txt')
    plt = draw_data(rawdata)
    plt.show()
    data = feature_mapping(rawdata['test1'],rawdata['test2'],power=6)
    #函数数据进行特征映射处理
    print(data.head())#处理后的数据
    x = data.values
    y = rawdata['accept']
    theta = np.zeros(x.shape[1])#初始化参数theta
    theta=opt.minimize(fun=regularized_cost_function,x0=theta,args=(x,y,1),method='tnc',jac=regularized_gradient_descent)
    theta=theta.x
    boundary(theta,rawdata,x,y)
main()
   f00      f01       f10       f02       f11       f20       f03       f12  \
0  1.0  0.69956  0.051267  0.489384  0.035864  0.002628  0.342354  0.025089
1  1.0  0.68494 -0.092742  0.469143 -0.063523  0.008601  0.321335 -0.043509
2  1.0  0.69225 -0.213710  0.479210 -0.147941  0.045672  0.331733 -0.102412
3  1.0  0.50219 -0.375000  0.252195 -0.188321  0.140625  0.126650 -0.094573
4  1.0  0.46564 -0.513250  0.216821 -0.238990  0.263426  0.100960 -0.111283

        f21       f30      ...            f32       f41           f50  \
0  0.001839  0.000135      ...       0.000066  0.000005  3.541519e-07
1  0.005891 -0.000798      ...      -0.000374  0.000051 -6.860919e-06
2  0.031616 -0.009761      ...      -0.004677  0.001444 -4.457837e-04
3  0.070620 -0.052734      ...      -0.013299  0.009931 -7.415771e-03
4  0.122661 -0.135203      ...      -0.029315  0.032312 -3.561597e-02

        f06       f15       f24       f33       f42           f51  \
0  0.117206  0.008589  0.000629  0.000046  0.000003  2.477505e-07
1  0.103256 -0.013981  0.001893 -0.000256  0.000035 -4.699318e-06
2  0.110047 -0.033973  0.010488 -0.003238  0.001000 -3.085938e-04
3  0.016040 -0.011978  0.008944 -0.006679  0.004987 -3.724126e-03
4  0.010193 -0.011235  0.012384 -0.013650  0.015046 -1.658422e-02

            f60
0  1.815630e-08
1  6.362953e-07
2  9.526844e-05
3  2.780914e-03
4  1.827990e-02

[5 rows x 28 columns]

参考学习博客:
https://blog.csdn.net/zy1337602899/article/details/84777396
https://blog.csdn.net/Cowry5/article/details/80247569

