【曲线拟合】python实现二维曲线拟合
使用一种函数模型
import numpy as np
import matplotlib.pyplot as plt
from scipy.optimize import curve_fit


# 定义x、y散点坐标
x = [0.012, 0.024, 0.06, 0.12, 0.24, 0.38, 0.6, 1.2, 1.8, 3.0, 3.8, 6.0, 12.0]
y = [927.0, 913.0, 877.0, 856.0, 854.0, 853.0, 850.0, 842.0, 838.0, 836.0, 835.0, 833.0, 830.0]
x = np.array(x)
y = np.array(y)
print('x is :\n', x)
print('y is :\n', y)


# 使用curve_fit 自定义函数
def mi(x, a, b, c):
    return a * (np.power(x, b) + c)


# 非线性最小二乘法拟合
# popt返回给定模型的最优参数值 pcov为协方差

popt, pcov = curve_fit(mi, x, y)
# 获取popt里面是拟合系数
a = popt[0]
b = popt[1]
c = popt[2]

yvals = mi(x, a, b, c)  # 拟合y值

print('系数a:', a)
print('系数b:', b)
print('系数c:', c)
print('系数pcov:', pcov)
print('系数yvals:', yvals)

# 绘图
plot1 = plt.plot(x, y, 's', label='original values')
plot2 = plt.plot(x, yvals, 'r', label='polyfit values')
plt.xlabel('x')
plt.ylabel('y')
plt.title('Title')
plt.legend(loc=1)
plt.savefig('/Users/supremebeast/Desktop/demo.png')
使用多种函数模型,取最优
import numpy as np
import matplotlib.pyplot as plt
from scipy.optimize import curve_fit
from scipy import log


# 定义x、y散点坐标
x = [0.012, 0.024, 0.06, 0.12, 0.24, 0.38, 0.6, 1.2, 1.8, 3.0, 3.8, 6.0, 12.0]
y = [927.0, 913.0, 877.0, 856.0, 854.0, 853.0, 850.0, 842.0, 838.0, 836.0, 835.0, 833.0, 830.0]
x = np.array(x)
y = np.array(y)
print('x is :\n', x)
print('y is :\n', y)


# 使用curve_fit 自定义函数
def mi(x, a, b, c):
    return a * (np.power(x, b) + c)


def zhishu(x, a, b, c):
    return a * np.exp(b * x) + c


def duishu(x, a, b):
    return a * log(x) + b


# 非线性最小二乘法拟合
# popt返回给定模型的最优参数值 pcov为协方差
def do_fit(func):
    popt, pcov = curve_fit(func, x, y)
    # 获取popt里面是拟合系数
    a = popt[0]
    b = popt[1]
    if func.__name__ != 'duishu':
        c = popt[2]
        yvals = func(x, a, b, c)  # 拟合y值
    else:
        yvals = func(x, a, b)

    # 计算误差函数
    tot = 0
    for i in range(13):
        tot += (y[i]-yvals[i])**2
    res = tot/13
    return res, func.__name__


# 计算每个拟合函数的误差函数
res1 = do_fit(mi)
res2 = do_fit(zhishu)
res3 = do_fit(duishu)
res = [res1, res2, res3]


# 打印拟合相关数据并保存拟合结果图片
def show(func):
    popt, pcov = curve_fit(func, x, y)
    # 获取popt里面是拟合系数
    a = popt[0]
    b = popt[1]
    if func.__name__ != 'duishu':
        c = popt[2]
        print('系数c:', c)
        yvals = func(x, a, b, c)  # 拟合y值
    else:
        yvals = func(x, a, b)

    print('方差:', res)
    print('系数a:', a)
    print('系数b:', b)
    print('系数pcov:', pcov)
    print('系数yvals:', yvals)

    # 绘图
    plot1 = plt.plot(x, y, 's', label='original values')
    plot2 = plt.plot(x, yvals, 'r', label='polyfit values')
    plt.xlabel('x')
    plt.ylabel('y')
    plt.title('Title')
    plt.legend(loc=1)
    plt.savefig('/Users/supremebeast/Desktop/demo.png')


minn = sorted(res, key=lambda item: item[0])[0][1]

# 取最佳拟合输出
if minn == 'mi':
    show(mi)
elif minn == 'zhishu':
    show(zhishu)
else:
    show(duishu)
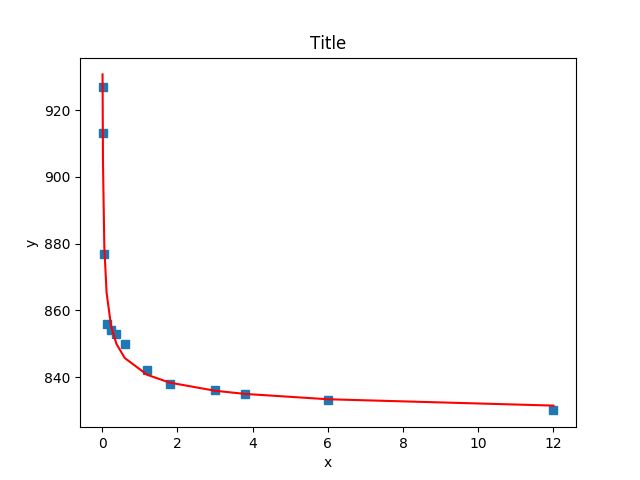
效果图
参考资料
python 对于任意数据和曲线进行拟合并求出函数表达式的三种方案。
matlab 万能实用的非线性曲线拟合方法
