- 官方教程地址:Tutorials for WGCNA R package
- 数据地址:FemaleLiver
- 表达数据格式: 芯片数据
options(stringsAsFactors = FALSE)
library(WGCNA)
数据输入和预处理
data = read.csv("LiverFemale3600.csv") #载入表达数据
exp = as.data.frame(t(data[, -c(1:8)]))
names(exp) = data$substanceBXH
rownames(exp) = names(data)[-c(1:8)]

gsg = goodSamplesGenes(exp, verbose = 3) #用于检查缺失值,'3'来自官方教程;
gsg$allOK #allOK为T说明无缺失
if(gsg$allOK==F){
  # Optionally, print the gene and sample names that were removed:
  if (sum(!gsg$goodGenes)>0)
    printFlush(paste("Removing genes:", paste(names(datExpr0)[!gsg$goodGenes], collapse = ", ")));
  if (sum(!gsg$goodSamples)>0)
    printFlush(paste("Removing samples:", paste(rownames(datExpr0)[!gsg$goodSamples], collapse = ", ")));
  # Remove the offending genes and samples from the data:
  datExpr0 = datExpr0[gsg$goodSamples, gsg$goodGenes]
}

sampleTree = hclust(dist(exp), method = "average") #聚类样本,观察是否有离群值
plot(sampleTree, main = "Sample clustering to detect outliers", sub="", xlab="", cex.lab = 1.5,
     cex.axis = 1.5, cex.main = 2)
abline(h = 15, col = "red") #图中划定需要剪切的枝长,高度可选
clust = cutreeStatic(sampleTree, cutHeight = 15, minSize = 10) #剪切高度和一个clust的最小样本数
table(clust);keepSamples = (clust==1);exp=exp[keepSamples,]  #手动去除离群值,保留非离群(clust==1)的样本
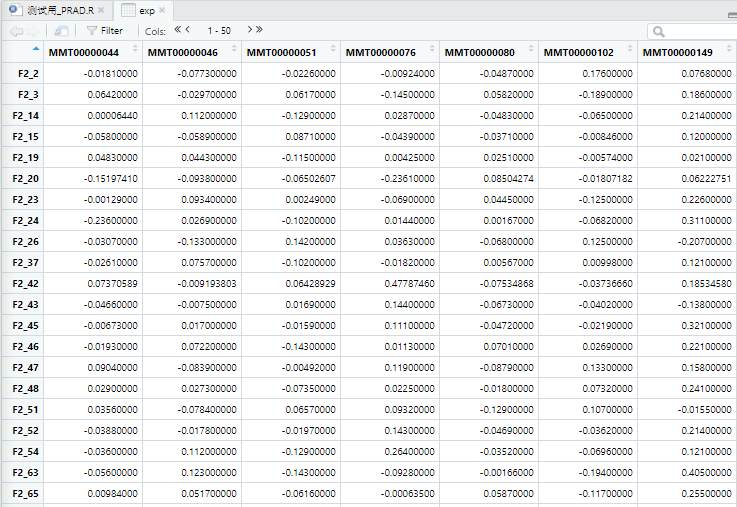
View(exp)
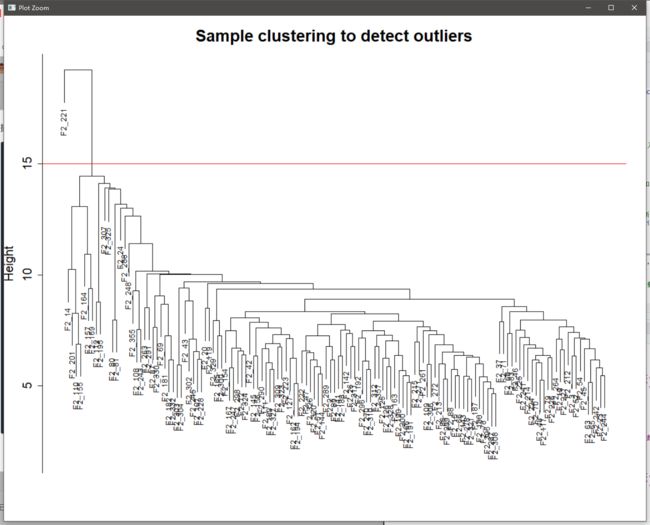
hclust plot

data_cl = read.csv("ClinicalTraits.csv") #载入表型数据,保留连续变量
clinical = data_cl[, c(2,11:15,17:30,32:38)]
t_row = match(rownames(exp),clinical$Mice)
clinical = clinical[t_row,];rownames(clinical)=clinical[,1];clinical=clinical[,-1]

sampleTree2 = hclust(dist(exp), method = "average") #可视化表型数据与基因表达量数据的联系,重构样本聚类树
traitColors = numbers2colors(clinical, signed = FALSE) #white means low, red means high, grey means missing entry
plotDendroAndColors(sampleTree2, traitColors,
                    groupLabels = names(clinical),
                    main = "Sample dendrogram and trait heatmap")

save(exp, clinical, file = "exp_with_clinical.RData")
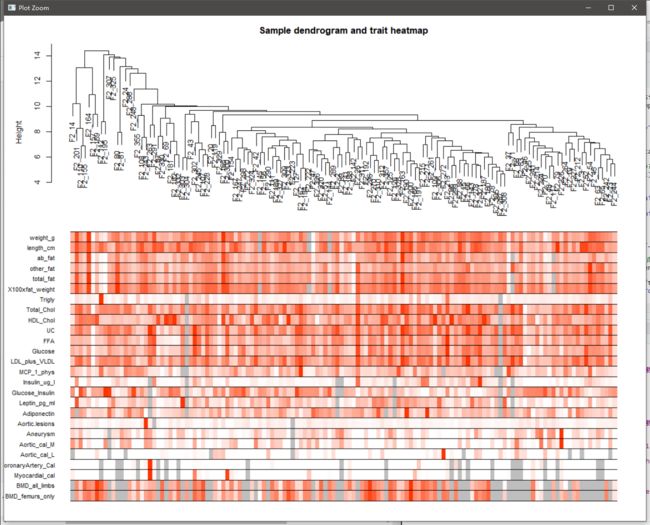
有表型数据的hclust plot
构建表达网络
1、选择软阈值
load("exp_with_clinical.RData")

powers = c(c(1:10), seq(from = 12, to=20, by=2)) #调试软阈值
sft = pickSoftThreshold(exp, powerVector = powers, verbose = 5)

plot(sft$fitIndices[,1], -sign(sft$fitIndices[,3])*sft$fitIndices[,2], #作图,“无标度拓扑拟合指数”
     xlab="Soft Threshold (power)",ylab="Scale Free Topology Model Fit,signed R^2",type="n",
     main = paste("Scale independence"))
text(sft$fitIndices[,1], -sign(sft$fitIndices[,3])*sft$fitIndices[,2],
     labels=powers,cex=cex1,col="red");
abline(h=0.90,col="red")  #查看位于0.9以上的点,0.9可选

plot(sft$fitIndices[,1], sft$fitIndices[,5], #作图,“平均连接度”
     xlab="Soft Threshold (power)",ylab="Mean Connectivity", type="n",
     main = paste("Mean connectivity"))
text(sft$fitIndices[,1], sft$fitIndices[,5], labels=powers, cex=cex1,col="red") #当power大于6,变化趋平,说明“软阈值为6时,网络的连通性好”

#sft$powerEstimate #自动推荐软阈值,也为6
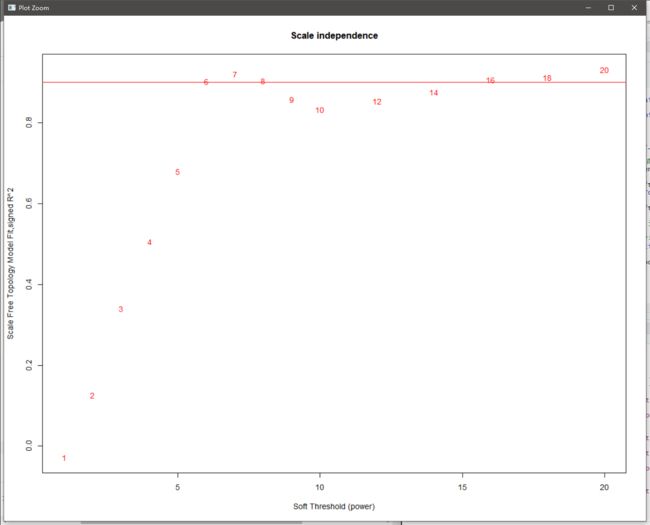
无标度拓扑拟合指数图
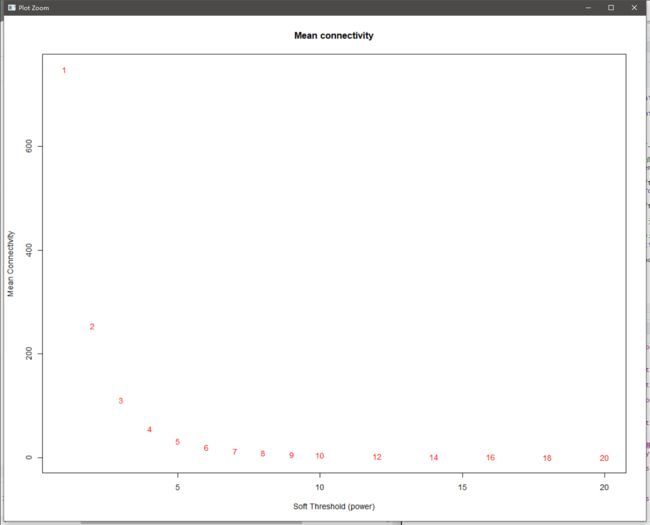
平均连接度图
2、一步法构建网络和模块识别
enableWGCNAThreads() #为WGCNA开启多线程

net = blockwiseModules(exp, power = 6,
                       TOMType = "unsigned", minModuleSize = 30,
                       reassignThreshold = 0, mergeCutHeight = 0.25,
                       numericLabels = TRUE, pamRespectsDendro = FALSE,
                       saveTOMs = TRUE,
                       saveTOMFileBase = "femaleMouseTOM",
                       verbose = 3)
#power = 6是刚才选择的软阈值
#minModuleSize:模块中最少的基因数
#mergeCutHeight :模块合并阈值,阈值越大,模块越少(重要)
#saveTOMs = TRUE,saveTOMFileBase = "femaleMouseTOM"保存TOM矩阵,名字为"femaleMouseTOM"
#net$colors 包含模块分配,net$MEs 包含模块的模块特征基因。

moduleLabels = net$colors #每个基因对应的颜色label
moduleColors.exp = labels2colors(net$colors) #每个label对应的颜色,数量和顺序均和colnames(exp)对应
geneTree = net$dendrograms[[1]]

plotDendroAndColors(geneTree, moduleColors[net$blockGenes[[1]]], #作图
                    "Module colors",
                    dendroLabels = FALSE, hang = 0.03,
                    addGuide = TRUE, guideHang = 0.05)

save(moduleLabels, moduleColors.exp, geneTree,file = "moduleLabels_moduleColors.exp_geneTree.RData") #保存模块分配和模块特征基因信息
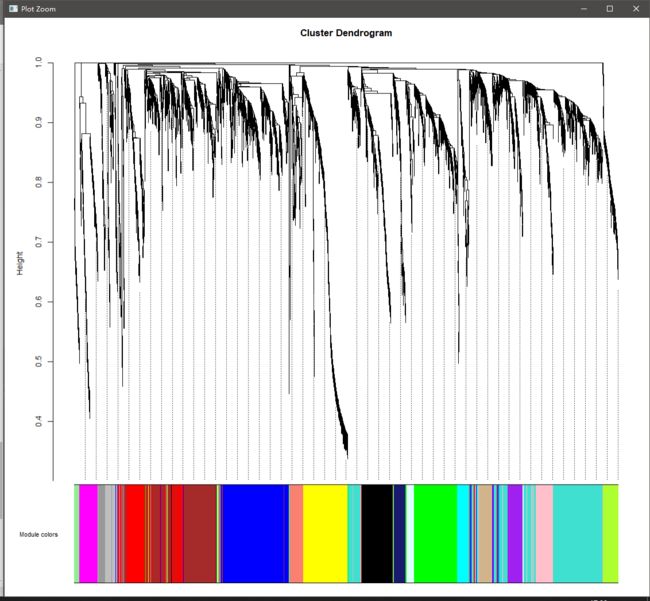
基因聚类加module图
模块与表型
1、模块与表型相关性分析
load("E:/Research/PRAD Data Mining/干实验/FemaleLiver_exp_with_clinical.RData")
load("E:/Research/PRAD Data Mining/干实验/FemaleLiver-02-networkConstruction-auto.RData")

nGenes = ncol(exp)
nSamples = nrow(exp)
ME = moduleEigengenes(exp, modColors.exp)$eigengenes #识别模块中的eigengenes
ME = orderMEs(ME) #使相似的ME相邻,利于绘图
moduleTrait.cor = cor(ME, clinical, use = "p") #计算各模块ME和表型的Pearson correlation
moduleTrait.pvalue = corPvalueStudent(moduleTrait.cor, nSamples)

textMatrix = paste(signif(moduleTrait.cor, 2), "\n(", #组合pearson相关系数和p值,paste返回vecto
                   signif(moduleTrait.pvalue, 1), ")", sep = "")
dim(textMatrix) = dim(moduleTrait.cor)
labeledHeatmap(Matrix = moduleTrait.cor, #热图作图
               xLabels = names(clinical),
               yLabels = names(ME),
               ySymbols = names(ME),
               colorLabels = FALSE,
               colors = greenWhiteRed(50), #greenWhiteRed(50)等
               textMatrix = textMatrix,
               setStdMargins = FALSE,
               cex.text = 0.5,
               zlim = c(-1,1),
               main = paste("Module-trait relationships"))

export::graph2ppt(file = 'example') #export包导出ppt格式图片(可编辑)
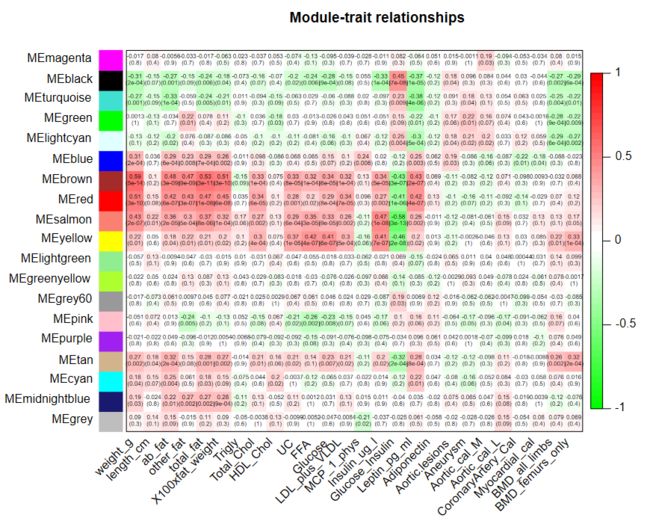
模块与表型相关性图
- 计算module和表型的相关性,即计算module eigengene(ME)和表型间的相关性
2、量化GS和MM(GS:基因与表型相关性,MM:基因与ME相关性)
spe_trait = as.data.frame(clinical$weight_g);colnames(spe_trait) = 'special_trait' #指定特定表型
modColors.ME = substring(names(ME), 3) #提取module颜色

MM = as.data.frame(cor(exp, ME, use = "p")) #计算各基因表达量和各模块的相关性,MM
MM.pvalue = as.data.frame(corPvalueStudent(as.matrix(MM), nSamples)) #MM的显著性
names(MM) = paste("MM.", modColors.ME, sep="")
names(MM.pvalue) = paste("pMM.", modColors.ME, sep="")

GS = as.data.frame(cor(exp, spe_trait , use = "p")) #计算各基因表达量和special_trait的相关性,GS
GS.pvalue = as.data.frame(corPvalueStudent(as.matrix(GS), nSamples)) #GS的显著性
names(GS) = paste("GS.", names(spe_trait), sep="")
names(GS.pvalue) = paste("pGS.", names(spe_trait), sep="")
3、指定模块内观察GS和MS的相关性
module = "brown" #指定模块颜色
t_color = match(module, modColors.ME)
t_gene = modColors.exp==module
verboseScatterplot(abs(MM[t_gene, t_color]), #可视化GS和MM,行为brown内基因的MM,列为brown内基因的GS
                   abs(GS[t_gene, 'GS.special_trait']),
                   xlab = paste("Module Membership in", module, "module"),
                   ylab = paste("Gene significance for special_trait in", module, 'module'),
                   main = paste("Module membership vs gene significance\n"),
                   cex.main = 1.2, cex.lab = 1.2, cex.axis = 1.2, col = module)
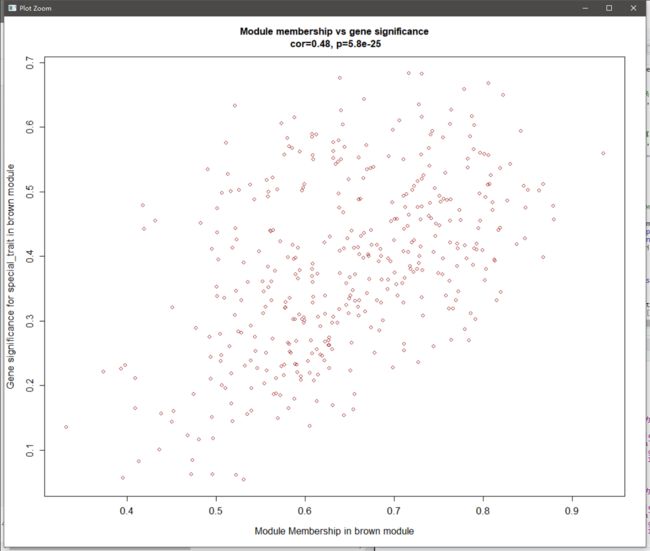
MM和GS相关性图
- MM:代表基因和module的相关性
- GS:代表基因和研究表型的相关性
- 如图,基因和module的相关性越高则和表型的相关性也越高,说明module和表型高度相关
4、输出总基因的GS和MM数据
geneInfo0 = data.frame('gene_id' = colnames(exp), #加上各基因的GS和pGS
                       'moduleColor' = modColors.exp,
                       geneTraitSignificance = GS,
                       geneTraitSignificanc_pvalue = GS.pvalue)

modOrder = order(abs(cor(ME, spe_trait, use = "p")),decreasing = T) #对module与表型间的相关性进行排序
for (mod in 1:ncol(MM)){ #将各基因的MM和pMM加入到geneInfo0中
  oldNames = names(geneInfo0)
  geneInfo0 = data.frame(geneInfo0,
                         MM[, modOrder[mod]], #列在前的是和表型相关度较高的module
                         MM.pvalue[, modOrder[mod]])
  names(geneInfo0) = c(oldNames,
                       paste("MM.", modColors.ME[modOrder[mod]], sep=""),
                       paste("pMM.", modColors.ME[modOrder[mod]], sep=""))
}

geneOrder = order(geneInfo0$moduleColor, abs(geneInfo0$GS.special_trait), decreasing = T);geneInfo = geneInfo0[geneOrder, ]  #对各module中的基因的GS降序排列

write.csv(geneInfo,file = "geneInfo.csv",quote = T,row.names = T)
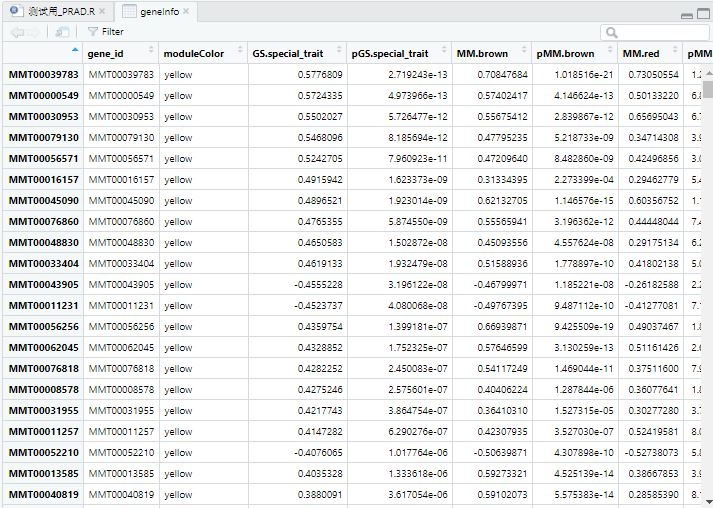
View(geneInfo)
 View(exp)
  hclust plot
 有表型数据的hclust plot
 无标度拓扑拟合指数图
  平均连接度图
 基因聚类加module图
 模块与表型相关性图
 MM和GS相关性图
 View(geneInfo)
