TensorFlow与Flask结合打造手写体数字识别 https://www.imooc.com/learn/994
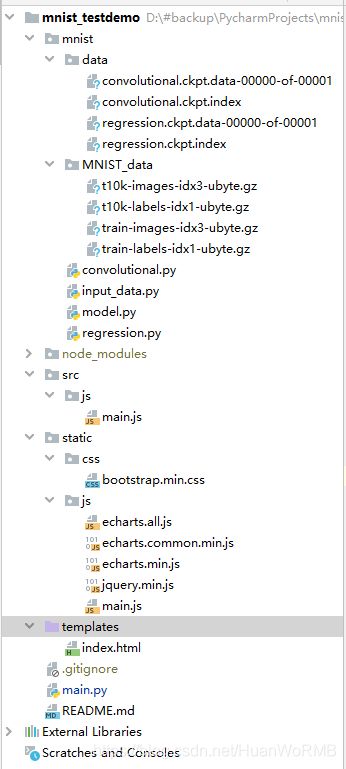
项目结构
convolutional.py
import os
import model
import tensorflow as tf
import input_data

data = input_data.read_data_sets('MNIST_data', one_hot=True)

with tf.variable_scope("convolutional"):
    x = tf.placeholder(tf.float32, [None, 784], name='x')
    keep_prob = tf.placeholder(tf.float32)
    y, variables = model.convolutional(x, keep_prob)

# train
y_ = tf.placeholder(tf.float32, [None, 10], name='y')
cross_entropy = -tf.reduce_sum(y_ * tf.log(y))
train_step = tf.train.AdamOptimizer(1e-4).minimize(cross_entropy)
correct_prediction = tf.equal(tf.argmax(y, 1), tf.argmax(y_, 1))
accuracy = tf.reduce_mean(tf.cast(correct_prediction, tf.float32))

saver = tf.train.Saver(variables)

with tf.Session() as sess:
    mergerd_summary_op = tf.summary.merge_all()
    summary_writer = tf.summary.FileWriter('/tmp/mnist_log/1', sess.graph)
    summary_writer.add_graph(sess.graph)
    sess.run(tf.global_variables_initializer())

    for i in range(20000):
        batch = data.train.next_batch(50)
        if i % 50 == 0:
            train_accuracy = accuracy.eval(feed_dict={x: batch[0], y_: batch[1], keep_prob: 1.0})
            print("step %d, trainging accuracy %g" % (i, train_accuracy))
        sess.run(train_step, feed_dict={x: batch[0], y_: batch[1], keep_prob: 0.5})
    print(sess.run(accuracy, feed_dict={x: data.test.images, y_: data.test.labels, keep_prob: 1.0}))

    path = saver.save(
        sess, os.path.join(os.path.dirname(__file__), 'data', 'convolutional.ckpt'),
        write_meta_graph=False, write_state=False)
    print("Saved:", path)
input_data.py
from __future__ import absolute_import, division, print_function

import gzip
import os
import tempfile

import numpy
from six.moves import urllib, xrange
import tensorflow as tf
from tensorflow.contrib.learn.python.learn.datasets.mnist import read_data_sets
model.py
import tensorflow as tf


# Y = W * x + b
def regression(x):
    W = tf.Variable(tf.zeros([784, 10]), name="W")
    b = tf.Variable(tf.zeros([10]), name="b")
    y = tf.nn.softmax(tf.matmul(x, W) + b)

    return y, [W, b]


def convolutional(x, keep_prob):
    def conv2d(x, W):
        return tf.nn.conv2d(x,W,[1, 1, 1, 1], padding='SAME')

    def max_pool_2x2(x):
        return tf.nn.max_pool(x, ksize=[1, 2, 2, 1], strides=[1, 2, 2, 1], padding='SAME')

    def weight_variable(shape):
        initial = tf.truncated_normal(shape, stddev=0.1)
        return tf.Variable(initial)

    def bias_variable(shape):
        initial = tf.constant(0.1, shape=shape)
        return tf.Variable(initial)

    x_image = tf.reshape(x, [-1, 28, 28, 1])

    W_conv1 = weight_variable([5, 5, 1, 32])
    b_conv1 = bias_variable([32])
    h_conv1 = tf.nn.relu(conv2d(x_image, W_conv1) + b_conv1)
    h_pool1 = max_pool_2x2(h_conv1)

    W_conv2 = weight_variable([5, 5, 32, 64])
    b_conv2 = bias_variable([64])
    h_conv2 = tf.nn.relu(conv2d(h_pool1, W_conv2) + b_conv2)
    h_pool2 = max_pool_2x2(h_conv2)

    # full connection
    W_fc1 = weight_variable([7 * 7 * 64, 1024])
    b_fc1 = bias_variable([1024])
    h_pool2_flat = tf.reshape(h_pool2, [-1, 7 * 7 * 64])
    h_fc1 = tf.nn.relu(tf.matmul(h_pool2_flat, W_fc1) + b_fc1)

    h_fc1_drop = tf.nn.dropout(h_fc1, keep_prob)

    W_fc2 = weight_variable([1024, 10])
    b_fc2 = bias_variable([10])
    y = tf.nn.softmax(tf.matmul(h_fc1_drop, W_fc2) + b_fc2)

    return y, [W_conv1, b_conv1, W_conv2, b_conv2, W_fc1, b_fc1, W_fc2, b_fc2]
regression.py
import os

import input_data
import model
import tensorflow as tf

data = input_data.read_data_sets('MNIST_data', one_hot=True)

# create model
with tf.variable_scope("regression"):
    x = tf.placeholder(tf.float32, [None, 784])
    y, variables = model.regression(x)

# train
y_ = tf.placeholder("float", [None, 10])
cross_entropy = -tf.reduce_sum(y_ * tf.log(y))
train_step = tf.train.GradientDescentOptimizer(0.01).minimize(cross_entropy)
correct_prediction = tf.equal(tf.argmax(y, 1), tf.argmax(y_, 1))
accuracy = tf.reduce_mean(tf.cast(correct_prediction, tf.float32))

# save
saver = tf.train.Saver(variables)
with tf.Session() as sess:
    sess.run(tf.global_variables_initializer())
    for _ in range(1000):
        batch_xs, batch_ys = data.train.next_batch(100)
        sess.run(train_step, feed_dict={x: batch_xs, y_: batch_ys})
    print((sess.run(accuracy, feed_dict={x: data.test.images, y_: data.test.labels})))

    path = saver.save(
        sess, os.path.join(os.path.dirname(__file__), 'data', 'regression.ckpt'),
        write_meta_graph=False, write_state=False)
    print("Saved:", path)
main.js
/* global $ */
class Main {
    constructor() {
        this.canvas = document.getElementById('main');
        this.input = document.getElementById('input');
        this.canvas.width  = 449; // 16 * 28 + 1
        this.canvas.height = 449; // 16 * 28 + 1
        this.ctx = this.canvas.getContext('2d');
        this.canvas.addEventListener('mousedown', this.onMouseDown.bind(this));
        this.canvas.addEventListener('mouseup',   this.onMouseUp.bind(this));
        this.canvas.addEventListener('mousemove', this.onMouseMove.bind(this));
        this.initialize();
    }
    initialize() {
        this.ctx.fillStyle = '#FFFFFF';
        this.ctx.fillRect(0, 0, 449, 449);
        this.ctx.lineWidth = 1;
        this.ctx.strokeRect(0, 0, 449, 449);
        this.ctx.lineWidth = 0.05;
        for (var i = 0; i < 27; i++) {
            this.ctx.beginPath();
            this.ctx.moveTo((i + 1) * 16,   0);
            this.ctx.lineTo((i + 1) * 16, 449);
            this.ctx.closePath();
            this.ctx.stroke();

            this.ctx.beginPath();
            this.ctx.moveTo(  0, (i + 1) * 16);
            this.ctx.lineTo(449, (i + 1) * 16);
            this.ctx.closePath();
            this.ctx.stroke();
        }
        this.drawInput();
        $('#output td').text('').removeClass('success');
    }
    onMouseDown(e) {
        this.canvas.style.cursor = 'default';
        this.drawing = true;
        this.prev = this.getPosition(e.clientX, e.clientY);
    }
    onMouseUp() {
        this.drawing = false;
        this.drawInput();
    }
    onMouseMove(e) {
        if (this.drawing) {
            var curr = this.getPosition(e.clientX, e.clientY);
            this.ctx.lineWidth = 16;
            this.ctx.lineCap = 'round';
            this.ctx.beginPath();
            this.ctx.moveTo(this.prev.x, this.prev.y);
            this.ctx.lineTo(curr.x, curr.y);
            this.ctx.stroke();
            this.ctx.closePath();
            this.prev = curr;
        }
    }
    getPosition(clientX, clientY) {
        var rect = this.canvas.getBoundingClientRect();
        return {
            x: clientX - rect.left,
            y: clientY - rect.top
        };
    }
    drawInput() {
        var ctx = this.input.getContext('2d');
        var img = new Image();
        img.onload = () => {
            var inputs = [];
            var small = document.createElement('canvas').getContext('2d');
            small.drawImage(img, 0, 0, img.width, img.height, 0, 0, 28, 28);
            var data = small.getImageData(0, 0, 28, 28).data;
            for (var i = 0; i < 28; i++) {
                for (var j = 0; j < 28; j++) {
                    var n = 4 * (i * 28 + j);
                    inputs[i * 28 + j] = (data[n + 0] + data[n + 1] + data[n + 2]) / 3;
                    ctx.fillStyle = 'rgb(' + [data[n + 0], data[n + 1], data[n + 2]].join(',') + ')';
                    ctx.fillRect(j * 5, i * 5, 5, 5);
                }
            }
            if (Math.min(...inputs) === 255) {
                return;
            }
            $.ajax({
                url: '/api/mnist',
                method: 'POST',
                contentType: 'application/json',
                data: JSON.stringify(inputs),
                success: (data) => {
                    for (let i = 0; i < 2; i++) {
                        var max = 0;
                        var max_index = 0;
                        for (let j = 0; j < 10; j++) {
                            var value = Math.round(data.results[i][j] * 1000);
                            if (value > max) {
                                max = value;
                                max_index = j;
                            }
                            var digits = String(value).length;
                            for (var k = 0; k < 3 - digits; k++) {
                                value = '0' + value;
                            }
                            var text = '0.' + value;
                            if (value > 999) {
                                text = '1.000';
                            }
                            $('#output tr').eq(j + 1).find('td').eq(i).text(text);
                        }
                        for (let j = 0; j < 10; j++) {
                            if (j === max_index) {
                                $('#output tr').eq(j + 1).find('td').eq(i).addClass('success');
                            } else {
                                $('#output tr').eq(j + 1).find('td').eq(i).removeClass('success');
                            }
                        }
                    }
                }
            });
        };
        img.src = this.canvas.toDataURL();
    }
}

$(() => {
    var main = new Main();
    $('#clear').click(() => {
        main.initialize();
    });
});
main.js
document.write("");
class Main {
    constructor() {
        this.canvas = document.getElementById('main');
        this.input = document.getElementById('input');
        this.canvas.width = 449; // 16 * 28 + 1
        this.canvas.height = 449; // 16 * 28 + 1
        this.ctx = this.canvas.getContext('2d');
        this.canvas.addEventListener('mousedown', this.onMouseDown.bind(this));
        this.canvas.addEventListener('mouseup', this.onMouseUp.bind(this));
        this.canvas.addEventListener('mousemove', this.onMouseMove.bind(this));
        this.initialize();
    }

    initialize() {
        this.ctx.fillStyle = '#FFFFFF';
        this.ctx.fillRect(0, 0, 449, 449);
        this.ctx.lineWidth = 1;
        this.ctx.strokeRect(0, 0, 449, 449);
        this.ctx.lineWidth = 0.05;
        for (var i = 0; i < 27; i++) {
            this.ctx.beginPath();
            this.ctx.moveTo((i + 1) * 16, 0);
            this.ctx.lineTo((i + 1) * 16, 449);
            this.ctx.closePath();
            this.ctx.stroke();

            this.ctx.beginPath();
            this.ctx.moveTo(0, (i + 1) * 16);
            this.ctx.lineTo(449, (i + 1) * 16);
            this.ctx.closePath();
            this.ctx.stroke();
        }
        this.drawInput();
        $('#output td').text('').removeClass('success');
    }

    onMouseDown(e) {
        this.canvas.style.cursor = 'default';
        this.drawing = true;
        this.prev = this.getPosition(e.clientX, e.clientY);
    }

    onMouseUp() {
        this.drawing = false;
        this.drawInput();
    }

    onMouseMove(e) {
        if (this.drawing) {
            var curr = this.getPosition(e.clientX, e.clientY);
            this.ctx.lineWidth = 16;
            this.ctx.lineCap = 'round';
            this.ctx.beginPath();
            this.ctx.moveTo(this.prev.x, this.prev.y);
            this.ctx.lineTo(curr.x, curr.y);
            this.ctx.stroke();
            this.ctx.closePath();
            this.prev = curr;
        }
    }

    getPosition(clientX, clientY) {
        var rect = this.canvas.getBoundingClientRect();
        return {
            x: clientX - rect.left,
            y: clientY - rect.top
        };
    }

    drawInput() {
        var ctx = this.input.getContext('2d');
        var img = new Image();
        img.onload = () => {
            var inputs = [];
            var small = document.createElement('canvas').getContext('2d');
            small.drawImage(img, 0, 0, img.width, img.height, 0, 0, 28, 28);
            var data = small.getImageData(0, 0, 28, 28).data;
            for (var i = 0; i < 28; i++) {
                for (var j = 0; j < 28; j++) {
                    var n = 4 * (i * 28 + j);
                    inputs[i * 28 + j] = (data[n + 0] + data[n + 1] + data[n + 2]) / 3;
                    ctx.fillStyle = 'rgb(' + [data[n + 0], data[n + 1], data[n + 2]].join(',') + ')';
                    ctx.fillRect(j * 5, i * 5, 5, 5);
                }
            }
            if (Math.min(...inputs) === 255) {
                return;
            }
            $.ajax({
                url: '/api/mnist',
                method: 'POST',
                contentType: 'application/json',
                data: JSON.stringify(inputs),
                success: (data) => {
                    data = JSON.parse(data);
                    var value_1=new Array();
                    var value_2 = new Array();
                    for(var i=0;i<(data["site"][0]["output1"]).length;i++)
                    {
                        value_1[i] = Math.round(data["site"][0]["output1"][i] * 100);
                    }
                    for(var i=0;i<(data["site"][0]["output2"]).length;i++)
                    {
                        value_2[i] = Math.round(data["site"][0]["output2"][i] * 100);
                    }
                    // 获取最大值

                    var max_1 = Math.max.apply(Math,value_1);
                    var max_2 = Math.max.apply(Math,value_2);
                    var max_index_1 = value_1.indexOf(max_1);
                    var max_index_2 = value_2.indexOf(max_2);
                    for (let j=0;j<10;j++)
                    {
                         $('#result tr').eq(j + 1).find('td').eq(1).text(value_1[j]+"%");
                         if(j===max_index_1){
                             $('#result tr').eq(max_index_1+1).find('td').eq(1).addClass('success');
                         }
                    }
                    for (let j=0;j<10;j++)
                    {
                         $('#result tr').eq(j + 1).find('td').eq(2).text(value_2[j]+"%");
                         if(j===max_index_1){
                             $('#result tr').eq(max_index_2+1).find('td').eq(2).addClass('success');
                         }
                    }

                    // $("#regression").text(data.result);
                    // // 基于准备好的dom,初始化echarts实例
                    // var myChart = echarts.init($('#regression'));
                    // console.log(myChart);
                    // console.log('hhh');
                    // // 指定图表的配置项和数据
                    // var option = {
                    //     title: {
                    //         text: 'ECharts 入门示例'
                    //     },
                    //     tooltip: {},
                    //     legend: {
                    //         data: ['销量']
                    //     },
                    //     xAxis: {
                    //         data: ["衬衫", "羊毛衫", "雪纺衫", "裤子", "高跟鞋", "袜子"]
                    //     },
                    //     yAxis: {},
                    //     series: [{
                    //         name: '销量',
                    //         type: 'bar',
                    //         data: [5, 20, 36, 10, 10, 20]
                    //     }]
                    // };
                    //
                    // // 使用刚指定的配置项和数据显示图表。
                    // myChart.setOption(option);
                    // for (let i = 0; i < 2; i++) {
                    //     var max = 0;
                    //     var max_index = 0;
                    //     for (let j = 0; j < 10; j++) {
                    //         var value = Math.round(data.results[i][j] * 1000);
                    //         console.log(value);
                    //         if (value > max) {
                    //             max = value;
                    //             max_index = j;
                    //         }
                    //         var digits = String(value).length;
                    //         for (var k = 0; k < 3 - digits; k++) {
                    //             value = '0' + value;
                    //         }
                    //         var text = '0.' + value;
                    //         if (value > 999) {
                    //             text = '1.000';
                    //         }
                    //         $('#output tr').eq(j + 1).find('td').eq(i).text(text);
                    //     }
                    //     for (let j = 0; j < 10; j++) {
                    //         if (j === max_index) {
                    //             $('#output tr').eq(j + 1).find('td').eq(i).addClass('success');
                    //         } else {
                    //             $('#output tr').eq(j + 1).find('td').eq(i).removeClass('success');
                    //         }
                    //     }
                    // }
                }
            });
        };
        img.src = this.canvas.toDataURL();
    }
}

$(() => {
    var main = new Main();
    $('#clear').click(() => {
        main.initialize();
        console.log("hahh");
        for(let i=0;i<2;i++)
        {
            for(j=0;j<10;j++)
            {
                $('#result tr').eq(j + 1).find('td').eq(i+1).text(" ");
                $('#result tr').eq(j + 1).find('td').eq(i+1).removeClass('success');
            }
        }
    });
});
index.html
<!DOCTYPE html>
<html>
<head>
    <title>MNIST</title>
    <!-- 最新版本的 Bootstrap 核心 CSS 文件 -->
    <link rel="stylesheet" href="https://cdn.jsdelivr.net/npm/[email protected]/dist/css/bootstrap.min.css"
          integrity="sha384-BVYiiSIFeK1dGmJRAkycuHAHRg32OmUcww7on3RYdg4Va+PmSTsz/K68vbdEjh4u" crossorigin="anonymous">

    <!-- 可选的 Bootstrap 主题文件(一般不用引入) -->
    <link rel="stylesheet" href="https://cdn.jsdelivr.net/npm/[email protected]/dist/css/bootstrap-theme.min.css"
          integrity="sha384-rHyoN1iRsVXV4nD0JutlnGaslCJuC7uwjduW9SVrLvRYooPp2bWYgmgJQIXwl/Sp" crossorigin="anonymous">
    <script type="text/javascript" src="{{ url_for('static', filename='js/jquery.min.js') }}"></script>
    <!-- 最新的 Bootstrap 核心 JavaScript 文件 -->
    <script src="https://cdn.jsdelivr.net/npm/[email protected]/dist/js/bootstrap.min.js"
            integrity="sha384-Tc5IQib027qvyjSMfHjOMaLkfuWVxZxUPnCJA7l2mCWNIpG9mGCD8wGNIcPD7Txa"
            crossorigin="anonymous"></script>
    <script src="http://echarts.baidu.com/build/dist/echarts.js"></script>
    <script type="text/javascript" src="{{ url_for('static', filename='js/main.js') }}"></script>
</head>
<body>
<!--<a href="https://github.com/sugyan/tensorflow-mnist"><img style="position: absolute; top: 0; right: 0; border: 0;" src="https://camo.githubusercontent.com/a6677b08c955af8400f44c6298f40e7d19cc5b2d/68747470733a2f2f73332e616d617a6f6e6177732e636f6d2f6769746875622f726962626f6e732f666f726b6d655f72696768745f677261795f3664366436642e706e67" alt="Fork me on GitHub" data-canonical-src="https://s3.amazonaws.com/github/ribbons/forkme_right_gray_6d6d6d.png"></a>-->
<div class="container">
    <h1>MNIST</h1>
    <div class="row">
        <div class="col-md-6">
            <p>draw a digit here!</p>
            <canvas id="main"></canvas>
            <p>
                <button id="clear" class="btn btn-default">clear</button>
            </p>
        </div>
        <div class="col-md-6">
            <p>input:</p>
            <canvas id="input" style="border:1px solid" width="140" height="140"></canvas>
            <hr>
            <p>output:</p>
            <!-- 为 ECharts 准备一个具备大小(宽高)的 DOM -->
            <div id="regression" style="width: 600px;height:300px;">
                <table id="result" class="table table-condensed table-hover text-center" border="1">
                    <!-- On rows -->
                    <tr>
                        <td></td>
                        <td>regression</td>
                        <td>convolutional</td>
                    </tr>
                    <tr>
                        <td>0</td>
                        <td></td>
                        <td></td>
                    </tr>

                    <tr>
                        <td>1</td>
                        <td></td>
                        <td></td>
                    </tr>
                    <tr>
                        <td>2</td>
                        <td></td>
                        <td></td>
                    </tr>
                    <tr>
                        <td>3</td>
                        <td></td>
                        <td></td>
                    </tr>
                    <tr>
                        <td>4</td>
                        <td></td>
                        <td></td>
                    </tr>
                    <tr>
                        <td>5</td>
                        <td></td>
                        <td></td>
                    </tr>
                    <tr>
                        <td>6</td>
                        <td></td>
                        <td></td>
                    </tr>
                    <tr>
                        <td>7</td>
                        <td></td>
                        <td></td>
                    </tr>
                    <tr>
                        <td>8</td>
                        <td></td>
                        <td></td>
                    </tr>
                    <tr>
                        <td>9</td>
                        <td></td>
                        <td></td>
                    </tr>
                </table>
            </div>
        </div>
    </div>
</div>
</body>
</html>
main.py
import numpy as np
import tensorflow as tf
from flask import Flask,jsonify,render_template,request
import json
from mnist import model

x = tf.placeholder("float", [None, 784])
sess = tf.Session()

with tf.variable_scope("regression"):
    y1, variables = model.regression(x)
saver = tf.train.Saver(variables)
saver.restore(sess, "mnist/data/regression.ckpt")

with tf.variable_scope("convolutional"):
    keep_prob = tf.placeholder("float")
    y2, variables = model.convolutional(x, keep_prob)
saver = tf.train.Saver(variables)
saver.restore(sess, "mnist/data/convolutional.ckpt")


def regression(input):
    return sess.run(y1, feed_dict={x: input}).flatten().tolist()


def convolutional(input):
    return sess.run(y2, feed_dict={x: input, keep_prob: 1.0}).flatten().tolist()


app = Flask(__name__)


@app.route('/api/mnist', methods=['post'])
def mnist():
    input = ((255 - np.array(request.json, dtype=np.uint8)) / 255.0).reshape(1, 784)
    output1 = regression(input)
    output2 = convolutional(input)
    output = {}
    output["output1"] = output1
    output["output2"] = output2
    res = []
    res.append(output)
    a = {}
    a['site'] = res
    mydata = json.dumps(a, ensure_ascii=False).encode("utf8")
    return mydata
@app.route('/')
def main():
    return render_template('index.html')


if __name__ == '__main__':
    app.debug = True
    app.run(host='localhost', port=8000)