python中分类常用的方法
分类是数据处理常用的方法,今天介绍python中种常用的数据分析方法
1、线性逻辑分类
逻辑分类分为二元分类和多元分类
函数:y = 1 / (1 + e^-z) 其中 z = k1x1 + k2x2 + b
交叉熵误差:J(k1,k2,b) = sigma(-ylog(y') - (1-y)log(1-y')) / m + 正则函数 * 正则强度(目的是防止过拟合,提高模型泛化性能)
python方法:sklearn.linear_model.LogisticRegression(solver='liblinear', c=正则强度)
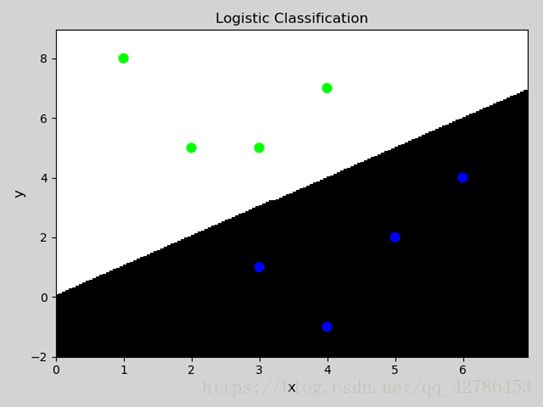
二元分类示例:
import numpy as np
import matplotlib.pyplot as mp
import sklearn.linear_model as lm

x = np.array([
    [3, 1],
    [2, 5],
    [1, 8],
    [6, 4],
    [5, 2],
    [3, 5],
    [4, 7],
    [4, -1]
])
y = np.array([0, 1, 1, 0, 0, 1, 1, 0])
model = lm.LogisticRegression(solver='liblinear', C=1)
model.fit(x, y)
l, r, h = x[:, 0].min() - 1, x[:, 0].max() + 1, 0.05
b, t, v = x[:, 1].min() - 1, x[:, 1].max() + 1, 0.05
grid_x = np.meshgrid(np.arange(l, r, h), np.arange(b, t, v))
flat_x = np.c_[grid_x[0].ravel(), grid_x[1].ravel()]
flat_y = model.predict(flat_x)
grid_y = flat_y.reshape(grid_x[0].shape)

mp.figure('Logistic Classification', facecolor='lightgray')
mp.title('Logistic Classification', fontsize=12)
mp.xlabel('x', fontsize=12)
mp.ylabel('y', fontsize=12)
mp.tick_params(labelsize=10)
# 根据颜色画图
mp.pcolormesh(grid_x[0], grid_x[1], grid_y, cmap='gray')
mp.scatter(x[:, 0], x[:, 1], c=y, cmap='brg', s=60)
mp.show()
结果:
多元分类示例:
import numpy as np
import matplotlib.pyplot as mp
import sklearn.linear_model as lm

x = np.array([
    [4, 7],
    [3.5, 8],
    [3.1, 6.2],
    [0.5, 1],
    [1, 2],
    [1.2, 1.9],
    [6, 2],
    [5.7, 1.5],
    [5.4, 2.2]
])
y = np.array([0, 0, 0, 1, 1, 1, 2, 2, 2])
model = lm.LogisticRegression(solver='liblinear', C=100)
model.fit(x, y)
l, r, h = x[:, 0].min() - 1, x[:, 0].max() + 1, 0.05
b, t, v = x[:, 1].min() - 1, x[:, 1].max() + 1, 0.05
grid_x = np.meshgrid(np.arange(l, r, h), np.arange(b, t, v))
flat_x = np.c_[grid_x[0].ravel(), grid_x[1].ravel()]
flat_y = model.predict(flat_x)
grid_y = flat_y.reshape(grid_x[0].shape)

mp.figure('Logistic Classification', facecolor='lightgray')
mp.title('Logistic Classification', fontsize=12)
mp.xlabel('x', fontsize=12)
mp.ylabel('y', fontsize=12)
mp.tick_params(labelsize=10)
mp.pcolormesh(grid_x[0], grid_x[1], grid_y, cmap='gray')
mp.scatter(x[:, 0], x[:, 1], c=y, cmap='brg', s=60)
mp.show()
结果:
2、朴素贝叶斯分类
适用场景:数据有限但数据分布的特征已知(概率密度函数),或数据无限多的情况
朴素贝叶斯定理: P(A|B) = P(A)P(B|A) / P(B)
B样本属于A类别的概率,正比于A类别出现的概率乘以A类别条件下B样本中每一个特征出现的概率的乘积
python方法:sklearn.naive_bayes.GaussianNB() (基于高斯函数的贝叶斯)
示例:
import numpy as np
import sklearn.naive_bayes as nb
import matplotlib.pyplot as mp

x, y = [], []
with open('../ML/data/multiple1.txt', 'r') as f:
    for line in f.readlines():
        data = [float(substr) for substr in line.split(',')]
        x.append(data[:-1])
        y.append(data[-1])
x = np.array(x)
y = np.array(y, dtype=int)
# 构建朴素贝叶斯分类
model = nb.GaussianNB()
model.fit(x, y)
# 栅格化
l, r, h = x[:, 0].min() - 1, x[:, 0].max() + 1, 0.05
b, t, v = x[:, 1].min() - 1, x[:, 1].max() + 1, 0.05
grid_x = np.meshgrid(np.arange(l, r, h),
                     np.arange(b, t, v))
flat_x = np.c_[grid_x[0].ravel(), grid_x[1].ravel()]
# 预测每个点对应的类别
flat_y = model.predict(flat_x)
grid_y = flat_y.reshape(grid_x[0].shape)

mp.figure('Naive Bayes Classification',
          facecolor='lightgray')
mp.title('Naive Bayes Classification', fontsize=12)
mp.xlabel('x', fontsize=12)
mp.ylabel('y', fontsize=12)
mp.tick_params(labelsize=10)
mp.pcolormesh(grid_x[0], grid_x[1], grid_y, cmap='gray')
mp.scatter(x[:, 0], x[:, 1], c=y, cmap='brg', s=60)
mp.show()
结果:
3、随机森林分类
代码:
import numpy as np
import sklearn.preprocessing as sp
import sklearn.ensemble as se
import sklearn.model_selection as ms

# 训练模型
data = []
with open('../ML/data/car.txt', 'r') as f:
    for line in f.readlines():
        # 最后一列是换行符
        data.append(line[:-1].split(','))
data = np.array(data).T
encoders, train_x, train_y = [], [], []
for row in range(len(data)):
    encoder = sp.LabelEncoder()
    if row < len(data) - 1:
        train_x.append(encoder.fit_transform(data[row]))
    else:
        train_y = encoder.fit_transform(data[row])
    encoders.append(encoder)
train_x = np.array(train_x).T
# 随机森林分类器
model = se.RandomForestClassifier(max_depth=9,
        n_estimators=140, random_state=7)
print(ms.cross_val_score(model, train_x, train_y,
            cv=2, scoring='f1_weighted').mean())
model.fit(train_x, train_y)

# 使用模型进行分类预测
data = [
    ['high', 'med', '5more', '4', 'big', 'low', 'unacc'],
    ['high', 'high', '4', '4', 'med', 'med', 'acc'],
    ['low', 'low', '2', '4', 'small', 'high', 'good'],
    ['low', 'med', '3', '4', 'med', 'high', 'vgood']
]
data = np.array(data).T
test_x = []
for row in range(len(data)):
    encoder = encoders[row]
    if row < len(data) - 1:
        test_x.append(encoder.transform(data[row]))
    else:
        test_y = encoder.transform(data[row])
    encoders.append(encoder)
test_x = np.array(test_x).T
pred_test_y = model.predict(test_x)
print(encoders[-1].inverse_transform(pred_test_y))
# ['unacc' 'acc' 'good' 'vgood']
4、支持向量机分类(SVM)
分类边界需要满足4个条件:
正确分类
支持向量到分类边界的距离相等
支持向量到分界线的间距最大
线性(直线,平面)
对于在低维度空间无法线性划分的样本,通过升维变换,在高维度空间寻找最佳线性分类边界
python中方法:sklearn.svm.SVC(kernel=核函数, c=正则强度)
核函数:线性函数:linear 多项式函数:'poly' 径向基函数:'rbf'
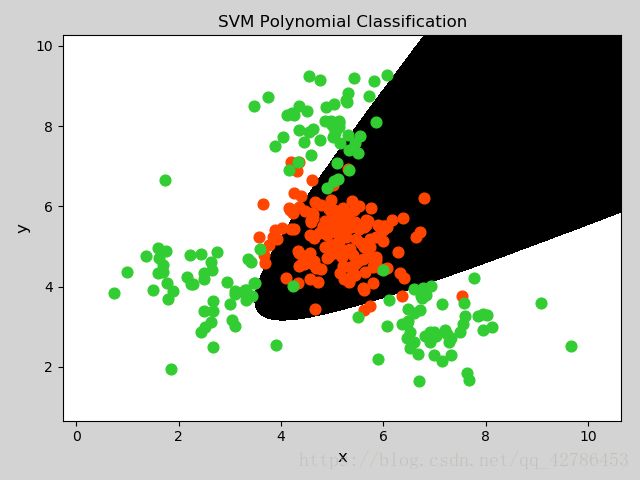
示例:
import numpy as np
import sklearn.model_selection as ms
import sklearn.svm as svm
import sklearn.metrics as sm
import matplotlib.pyplot as mp

x, y = [], []
with open('../ML/data/multiple2.txt', 'r') as f:
    for line in f.readlines():
        data = [float(substr) for substr in line.split(',')]
        x.append(data[:-1])
        y.append(data[-1])
x = np.array(x)
y = np.array(y, dtype=int)
train_x, test_x, train_y, test_y = ms.train_test_split(
                    x, y, test_size=0.25, random_state=7)
# 多项式核函数
model = svm.SVC(kernel='poly', degree=2)
model.fit(train_x, train_y)
l, r, h = x[:, 0].min() - 1, x[:, 0].max() + 1, 0.005
b, t, v = x[:, 1].min() - 1, x[:, 1].max() + 1, 0.005
grid_x = np.meshgrid(np.arange(l, r, h),
                     np.arange(b, t, v))
flat_x = np.c_[grid_x[0].ravel(), grid_x[1].ravel()]
flat_y = model.predict(flat_x)
grid_y = flat_y.reshape(grid_x[0].shape)
pred_test_y = model.predict(test_x)
print(sm.classification_report(test_y,pred_test_y))

mp.figure('SVM Polynomial Classification',
          facecolor='lightgray')
mp.title('SVM Polynomial Classification', fontsize=12)
mp.xlabel('x', fontsize=12)
mp.ylabel('y', fontsize=12)
mp.tick_params(labelsize=10)
mp.pcolormesh(grid_x[0], grid_x[1], grid_y, cmap='gray')
C0, C1 = y == 0, y == 1
mp.scatter(x[C0][:, 0], x[C0][:, 1],
           c='orangered', s =60)
mp.scatter(x[C1][:, 0], x[C1][:, 1],
           c='limegreen', s =60)
mp.show()
结果:
5、KNN分类
遍历训练集中的所有样本,计算每个样本与待测样本的距离,并从中找出k的最近邻。根据与距离成反比的权重,做加权投票(分类)或平均(回归),得到待测样本的类别标签或预测数值。
python中方法:sklearn.neighbors.KNeighborsClassifier(n_neighbors=最近邻个数, weights=‘distance’)
代码:
import numpy as np
import sklearn.neighbors as sn
import matplotlib.pyplot as mp

train_x, train_y = [], []
with open('../ML/data/knn.txt', 'r') as f:
    for line in f.readlines():
        data = [float(substr) for substr in line.split(',')]
        train_x.append(data[:-1])
        train_y.append(data[-1])
train_x = np.array(train_x)
train_y = np.array(train_y, dtype=int)
model = sn.KNeighborsClassifier(n_neighbors=10,
                                weights='distance')
model.fit(train_x, train_y)
l, r, h = train_x[:, 0].min() - 1, \
          train_x[:, 0].max() + 1, 0.05
b, t, v = train_x[:, 1].min() - 1, \
          train_x[:, 1].max() + 1, 0.05
grid_x = np.meshgrid(np.arange(l, r, h), np.arange(b, t, v))
flat_x = np.c_[grid_x[0].ravel(), grid_x[1].ravel()]
flat_y = model.predict(flat_x)
grid_y = flat_y.reshape(grid_x[0].shape)
test_x = np.array([
    [2.2, 6.2],
    [3.6, 1.8],
    [4.5, 3.6]
])
pred_test_y = model.predict(test_x)
nn_distances, nn_indices = model.kneighbors(test_x)

mp.figure('KNN Classification', facecolor='lightgray')
mp.title('KNN Classification', fontsize=12)
mp.xlabel('x', fontsize=12)
mp.ylabel('y', fontsize=12)
mp.tick_params(labelsize=10)
mp.pcolormesh(grid_x[0], grid_x[1], grid_y, cmap='gray')
classes = np.unique(train_y)
classes.sort()
cs = mp.get_cmap('brg', len(classes))(classes)
mp.scatter(train_x[:, 0], train_x[:, 1], c=cs[train_y], s=60)
mp.scatter(test_x[:, 0], test_x[:, 1],
           marker='D', c=cs[pred_test_y], s=60)
# 将预测结果的近邻用菱形画出来
for nn_index, y in zip(nn_indices, pred_test_y):
    mp.scatter(train_x[nn_index, 0],
               train_x[nn_index, 1],marker='D',
               edgecolor=cs[np.ones_like(nn_index) * y],
               facecolor = 'none', s=180)
mp.show()
结果:
今天先到这里,下次记录一下常用的回归方法。随机森林分类的原理,会在决策树回归方法中介绍。


