机器学习 之 客户分群案例
文章目录
- 前言
- 一、数据背景
- 二、代码
-
- 1.引入库
- 2.读入数据
- 3.EDA
- 4.RFM Estimation
- 5.通过Pareto/NBD model预测用户的活跃度alive
- 6.通过Pareto/NBD model预测用户的未来订单量
- 7.Gamma-Gamma Model前的数据准备
- 8.通过Gamma-Gamma Model去预测客户平均利润期望
- 9.通过Gamma-Gamma Model去预测客户CLV
- 10.客户分群
- 11.可视化分群结果
- 12.分析聚类结果
- 总结
前言
随着信息爆炸的时代来临。企业的用户量级和个人信息也呈指数型增长。如此在带来流量红利的同时,企业慢慢发现这个所谓的红利带来了不少难题:
- 难以管理用户关系
- 难以了解不同用户群的特点
- 竞争市场越来越激烈
- 盲目营销的成本越来越大
接下来通过一个真实历史交易数据集,通过LTV(客户生命周期价值)统计分析和聚类的方法分析不同用户群的特点,使得业务能够精准营销,从而降低营销成本。
提示:以下是本篇文章正文内容,下面案例可供参考
一、数据背景
- 此数据集包含2年期间发生在英国的在线零售的所有交易。
- 该公司主要销售各种场合的礼品
- 公司的很多客户都是批发商(B2B)
二、代码
1.引入库
我们会引入lifetimes开源工具库,该工具能够基于历史交易数据进行RFM的转换,并预测出用户未来所带来的价值(见后续),代码如下(示例):
import re
import matplotlib.pyplot as plt
import pandas as pd
import numpy as np
import seaborn as sns
import altair as alt
import plotly.express as px
import xlrd
import pandas as pd
import warnings
warnings.filterwarnings("ignore")
import datetime
import lifetimes
from lifetimes.plotting import plot_frequency_recency_matrix
from lifetimes.plotting import plot_probability_alive_matrix
from lifetimes.plotting import plot_period_transactions
from lifetimes.utils import calibration_and_holdout_data
from lifetimes import ParetoNBDFitter
from lifetimes.plotting import plot_history_alive
from sklearn.metrics import mean_squared_error, r2_score, mean_absolute_error
from lifetimes.plotting import plot_calibration_purchases_vs_holdout_purchases
from sklearn.cluster import KMeans
import math
import pickle
from math import sqrt
2.读入数据
data = pd.read_csv('./Data/Cleaned_Data.csv')
data.head()
| 特征 | 描述 |
|---|---|
| Invoice | 发票编号。标称。唯一分配给每笔交易的 6 位整数。如果此代码以字母“c”开头,则表示取消 |
| StockCode | 产品(项目)代码。标称。唯一分配给每个不同产品的 5 位整数 |
| Description | 产品(项目)名称。标称 |
| Quantity | 每笔交易的每个产品(项目)的数量 |
| InvoiceDate | 发票日期和时间,生成交易的日期和时间 |
| Price | 单价,以英镑 (£) 为单位的每单位产品价格 |
| CustomerID | 客户编号。标称。唯一分配给每个客户的 5 位整数 |
| Country | 国家名称。标称。客户所在国家/地区的名称 |
3.EDA
temp_data = data.copy()

#Date Time Analysis
data['InvoiceDate'] = pd.to_datetime(data['InvoiceDate'])
temp_data.loc[:, "Month"] = data.InvoiceDate.dt.month
temp_data.loc[:, "Time"] = data.InvoiceDate.dt.time
temp_data.loc[:, "Year"] = data.InvoiceDate.dt.year
temp_data.loc[:, "Day"] = data.InvoiceDate.dt.day
temp_data.loc[:, "Quarter"] = data.InvoiceDate.dt.quarter
temp_data.loc[:, "Day of Week"] = data.InvoiceDate.dt.dayofweek

#Mapping day of week
dayofweek_mapping = dict({0: "Monday",
                         1: "Tuesday",
                         2: "Wednesday" ,
                         3: "Thursday",
                         4: "Friday",
                         5: "Saturday",
                         6: "Sunday"})

temp_data["Day of Week"] = temp_data["Day of Week"].map(dayofweek_mapping)

plt.figure(figsize=(16,12))
plt.subplot(3,2,1)
sns.lineplot(x = "Month", y = "Quantity", data = temp_data.groupby("Month").sum("Quantity"), marker = "o", color = "lightseagreen")
plt.axvline(11, color = "k", linestyle = '--', alpha = 0.3)
plt.text(8.50, 1.3e6, "Most Transactions")
plt.title("Transactions by Month")
plt.subplot(3,2,2)
temp_data.groupby("Year").sum()["Quantity"].plot(kind = "bar")
plt.title("Transactions by Year")
plt.subplot(3,2,3)
temp_data.groupby("Quarter").sum()["Quantity"].plot(kind = "bar", color = "darkslategrey")
plt.title("Transactions by Quarter")
plt.subplot(3,2,4)
sns.lineplot(x = "Day", y = "Quantity", data = temp_data.groupby("Day").sum("Quantity"), marker = "o", )
plt.axvline(7, color = 'r', linestyle = '--')
plt.axvline(15, color = 'k', linestyle = "dotted")
plt.title("Transactions by Day")
plt.subplot(3,2,5)
temp_data.groupby("Day of Week").sum()["Quantity"].plot(kind = "bar", color = "darkorange")
plt.title("Transactions by Day of Week")
plt.tight_layout()
plt.show()
- 通过EDA可以看出交易的频繁周期大多发生在年底,因为国外的节假日基本都在这些时间点
- 2009-2010年订单量有大幅增长,通过数据分析了解到该时间段的客户量也有所增加
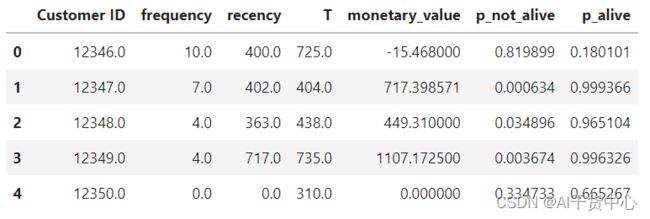
4.RFM Estimation
构造RFM数据样式
- frequency:复购次数
- recency:最近一次购买距离第一次购买的时间
- monetary_value:复购的平均消费
- T:客户第一次购买到研究期结束之间的持续时间。
# 计算客单价
data["Total Amount"] = data["Quantity"]*data["Price"]
data.head()

rfm_summary = lifetimes.utils.summary_data_from_transaction_data(data, "Customer ID", "InvoiceDate", "Total Amount")
rfm_summary.reset_index(inplace = True)
rfm_summary.head()
5.通过Pareto/NBD model预测用户的活跃度alive
pareto_model = lifetimes.ParetoNBDFitter(penalizer_coef = 0.1)
pareto_model.fit(rfm_summary["frequency"],rfm_summary["recency"],
                rfm_summary["T"])

pareto_result = rfm_summary.copy()

pareto_result["p_not_alive"] = 1-pareto_model.conditional_probability_alive(pareto_result["frequency"], pareto_result["recency"], pareto_result["T"])
pareto_result["p_alive"] = pareto_model.conditional_probability_alive(pareto_result["frequency"], pareto_result["recency"], pareto_result["T"])

pareto_result.head()
6.通过Pareto/NBD model预测用户的未来订单量
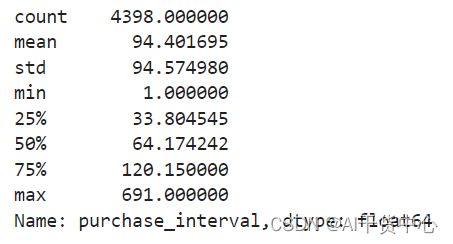
首先我们需要确认需要预测未来的天数t,这个t可以通过历史下单的时间间隔的中位数来确认,大概推断出用户多久下单一次。
pareto_result['purchase_interval'] = pareto_result['recency'] / pareto_result['frequency']
pareto_result['purchase_interval'].describe()
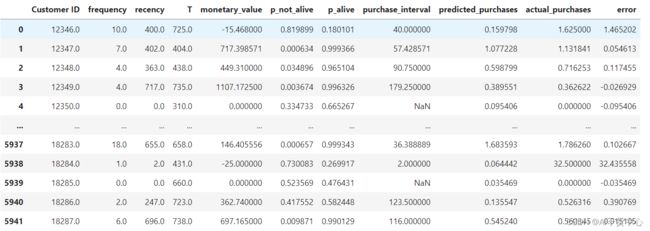
待确定了预测天数后,我们可以预测出未来t天内每个用户的购买情况predicted_purchases,除此之外,我们也会拿历史购买情况actual_purchases做对比
# 由上分布情况得出,65天的购买间隔
t = 65

pareto_result["predicted_purchases"] = pareto_model.conditional_expected_number_of_purchases_up_to_time(t, pareto_result["frequency"], pareto_result["recency"], pareto_result["T"])
pareto_result["actual_purchases"] = pareto_result["frequency"]/pareto_result["recency"]*t
pareto_result["actual_purchases"].fillna(0, inplace = True)
pareto_result["error"] = pareto_result["actual_purchases"]-pareto_result["predicted_purchases"]
pareto_result
7.Gamma-Gamma Model前的数据准备
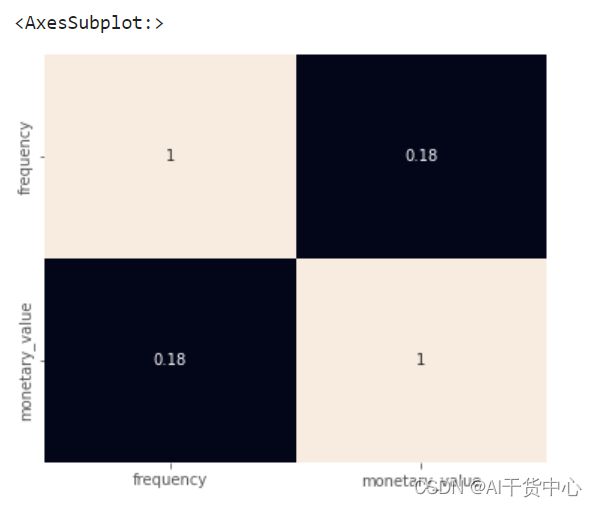
在预测前需要过滤掉没有复购行为和没有消费行为的用户,除此之外,需要满足frequency和monetary相互独立(此假设详见论文)
ggf_filter = pareto_result[(pareto_result["frequency"] > 0.0)&(pareto_result["monetary_value"] > 0.0)]

plt.figure(figsize=(6,5))
sns.heatmap(ggf_filter[["frequency", "monetary_value"]].corr(), annot = True, cbar = False)
8.通过Gamma-Gamma Model去预测客户平均利润期望
ggf_model =  lifetimes.GammaGammaFitter(penalizer_coef=0.1)

ggf_model.fit(ggf_filter["frequency"], ggf_filter["monetary_value"])

ggf_filter["expected_avg_sales_"] = ggf_model.conditional_expected_average_profit(ggf_filter["frequency"],
                                                                                     ggf_filter["monetary_value"])
ggf_filter.head()
print("Mean Absolute Error: %s" %(mean_absolute_error(ggf_filter["monetary_value"], ggf_filter["expected_avg_sales_"])))

-- Mean Absolute Error: 291.8293712227577

print('monetary_value:')
print(ggf_filter["monetary_value"].describe())
print('\n')
print('expected_avg_sales_:')
print(ggf_filter["expected_avg_sales_"].describe())

可以看出模型预测的期望利润总体较高,相较于历史利润持乐观态度
9.通过Gamma-Gamma Model去预测客户CLV
计算CLV也要确认未来周期天数t,这里也拿上面确认的65天为例
ggf_filter["predicted_clv"] = ggf_model.customer_lifetime_value(pareto_model,
                                                       ggf_filter["frequency"],
                                                       ggf_filter["recency"],
                                                       ggf_filter["T"],
                                                       ggf_filter["monetary_value"],
                                                       time = t,
                                                       freq = 'D',
                                                       discount_rate = 0.01)

#Top 5 customers with high CLV
ggf_filter[["Customer ID", "predicted_clv"]].sort_values(by = "predicted_clv", ascending = False).head(5)
10.客户分群
基于以上得到的LTV结果:
- 预测订单数 - predicted_purchases
- 平均利润期望 - expected_avg_sales_
- 客户价值 - predicted_clv
通过聚类的方法做客户分群,首先我们将数据做归一化,防止产生量级误差。然后利用手肘法找到最佳的簇类个数
from sklearn.preprocessing import MinMaxScaler

scaler = MinMaxScaler()
col = ["predicted_purchases", "expected_avg_sales_", "predicted_clv"]
new_df = scaler.fit_transform(ggf_filter[col])
inertia = []

for i in range(2, 11):
    cluster = KMeans(n_clusters = i, init = "k-means++").fit(new_df)
    inertia.append(cluster.inertia_)

plt.figure(figsize=(6,4))
plt.plot(range(2,11), inertia, marker = "*", linewidth = 1.8)
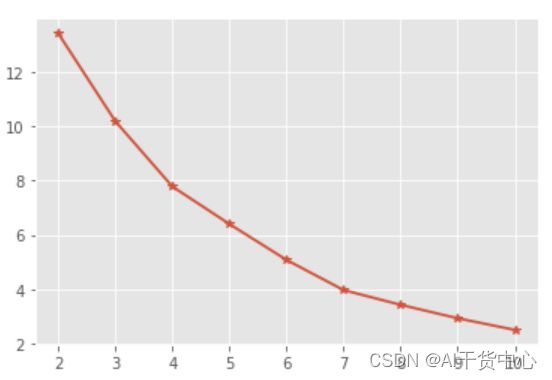
如上图,最佳簇类个数为4,紧接着开始KMeans聚类。
取出聚类后不同簇类的中心点
k_model = KMeans(n_clusters = 4, init = "k-means++", max_iter = 1000, random_state= 2022)
k_model_fit = k_model.fit(new_df)

ggf_filter['Cluster'] = k_model_fit.labels_
ggf_filter.head()
11.可视化分群结果
from mpl_toolkits.mplot3d import Axes3D
fig = plt.figure(figsize = (12,8))
ax = fig.add_subplot(projection='3d')
plt.set_cmap(plt.get_cmap("seismic", 100))
ax.scatter(ggf_filter[ggf_filter['Cluster'] == 0]['predicted_purchases'],ggf_filter[ggf_filter['Cluster'] == 0]['predicted_clv'],ggf_filter[ggf_filter['Cluster'] == 0]['expected_avg_sales_'],label = 0,c = 'deeppink',s = 40)
ax.scatter(ggf_filter[ggf_filter['Cluster'] == 1]['predicted_purchases'],ggf_filter[ggf_filter['Cluster'] == 1]['predicted_clv'],ggf_filter[ggf_filter['Cluster'] == 1]['expected_avg_sales_'],label = 1,c = 'lightgreen',s = 40)
ax.scatter(ggf_filter[ggf_filter['Cluster'] == 2]['predicted_purchases'],ggf_filter[ggf_filter['Cluster'] == 2]['predicted_clv'],ggf_filter[ggf_filter['Cluster'] == 2]['expected_avg_sales_'],label = 2,c = 'deepskyblue',s = 40)
ax.scatter(ggf_filter[ggf_filter['Cluster'] == 3]['predicted_purchases'],ggf_filter[ggf_filter['Cluster'] == 3]['predicted_clv'],ggf_filter[ggf_filter['Cluster'] == 3]['expected_avg_sales_'],label = 3,c = 'yellow',s = 40)
ax.set_xlabel('predicted_purchases_30_days')
ax.set_ylabel('predicted_clv')
ax.set_zlabel('expected_avg_sales_')
plt.legend()
12.分析聚类结果
- 0类客户支出次数较为谨慎,价值贡献较少
(Action:该用户群也许是价格敏感人群or,可以派发力度较大的限时优惠券,促进下次再度消费,快速回流复购;对该类客户的画像进行更加细致的分析,如用户媒体浏览偏好,历史购买行为,已有的用户画像标签等,然后实施更为精准营销,) - 1类客户平均利润期望处于一般水平,但是他们预测未来会贡献较多订单,所以这类客户是重要保持顾客,属于商店收入的中流砥柱
(Action:派发拉新/分享优惠券,利用该用户群基数大的特点带来更多流量) - 2类客户平均利润期望很高,但是预测的未来购买次数较少,可能是他们对商店提供的服务或者产品不满意,这类客户是营销团队瞄准的另一个理想群体,因为他们有潜力为商店带来更多利润
(Action:做简单的调查回访,了解客户是否在服务or产品方面有哪些不满意的地方。在回访过后可以派发优惠券,一方面促进再次消费,另一方面可以纳取更多该用户群的建议,便于后续改进) - 3类客户在LTV的三个维度上基本都高于平均水平。针对该群体进行营销将提高他们的消费分数并最大化利润。
(Action:该用户群可能不太在意价格高低,消费频次也比较稳定,可以提高优惠券的使用门槛,如满减优惠等,最大化利润收入)
总结
以上的客户分群角度主要是通过用户的历史交易信息RFM进行搭建分析。当然考虑的维度不会仅限于此,我们也可以通过用户画像标签,用户与多媒体的历史交互行为等维度进行客户分群,从而进行个性化推荐和精准营销,降低营销成本,提高转化、


