yolov5量化注意事项
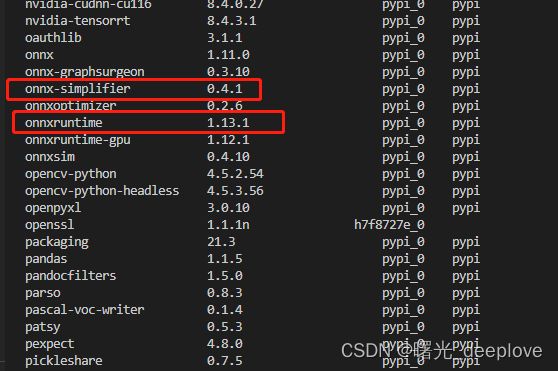
(1)使用onnxsim ==0.4.1版本、ort版本1.13.1
否则使用--dynamic True时所生成的onnx就会乱掉。
(2)利用trtexec生成engine
所使用的命令如下:
trtexec.exe --onnx=yolov5n_ptq_detect_dynamic.onnx --saveEngine=ptq_int8_fp16.trtmodel --int8 --fp16 === Trace details ===
[11/28/2022-01:21:54] [I] Trace averages of 10 runs:
[11/28/2022-01:21:54] [I] Average on 10 runs - GPU latency: 10.0542 ms - Host latency: 11.208 ms (end to end 35 ms, enqueue 1.81131 ms)
[11/28/2022-01:21:54] [I] Average on 10 runs - GPU latency: 9.81727 ms - Host latency: 10.5855 ms (end to end 19.5386 ms, enqueue 1.85647 ms)
[11/28/2022-01:21:54] [I] Average on 10 runs - GPU latency: 9.69315 ms - Host latency: 10.4373 ms (end to end 19.2861 ms, enqueue 1.95906 ms)
[11/28/2022-01:21:54] [I] Average on 10 runs - GPU latency: 9.70017 ms - Host latency: 10.3944 ms (end to end 19.3087 ms, enqueue 1.81692 ms)
[11/28/2022-01:21:54] [I] Average on 10 runs - GPU latency: 9.65495 ms - Host latency: 10.3942 ms (end to end 19.2211 ms, enqueue 1.72121 ms)
[11/28/2022-01:21:54] [I] Average on 10 runs - GPU latency: 9.65385 ms - Host latency: 10.3949 ms (end to end 19.2132 ms, enqueue 1.82804 ms)
[11/28/2022-01:21:54] [I] Average on 10 runs - GPU latency: 9.68204 ms - Host latency: 10.3647 ms (end to end 19.2656 ms, enqueue 1.70457 ms)
[11/28/2022-01:21:54] [I] Average on 10 runs - GPU latency: 9.67172 ms - Host latency: 10.3892 ms (end to end 19.2918 ms, enqueue 1.89681 ms)
[11/28/2022-01:21:54] [I] Average on 10 runs - GPU latency: 9.68694 ms - Host latency: 10.3927 ms (end to end 19.2497 ms, enqueue 1.7677 ms)
[11/28/2022-01:21:54] [I] Average on 10 runs - GPU latency: 9.69882 ms - Host latency: 10.4191 ms (end to end 19.3633 ms, enqueue 1.74553 ms)
[11/28/2022-01:21:54] [I] Average on 10 runs - GPU latency: 9.7099 ms - Host latency: 10.4437 ms (end to end 19.2994 ms, enqueue 1.73564 ms)
[11/28/2022-01:21:54] [I] Average on 10 runs - GPU latency: 9.66166 ms - Host latency: 10.3627 ms (end to end 19.2514 ms, enqueue 1.70513 ms)
[11/28/2022-01:21:54] [I] Average on 10 runs - GPU latency: 9.6746 ms - Host latency: 10.4315 ms (end to end 19.2513 ms, enqueue 1.89272 ms)
[11/28/2022-01:21:54] [I] Average on 10 runs - GPU latency: 9.68583 ms - Host latency: 10.4422 ms (end to end 19.3063 ms, enqueue 1.74606 ms)
[11/28/2022-01:21:54] [I] Average on 10 runs - GPU latency: 9.67321 ms - Host latency: 10.4389 ms (end to end 19.2466 ms, enqueue 1.88253 ms)
[11/28/2022-01:21:54] [I] Average on 10 runs - GPU latency: 9.53226 ms - Host latency: 10.2362 ms (end to end 18.9538 ms, enqueue 1.80453 ms)
[11/28/2022-01:21:54] [I] Average on 10 runs - GPU latency: 9.54962 ms - Host latency: 10.2289 ms (end to end 18.9619 ms, enqueue 1.70771 ms)
[11/28/2022-01:21:54] [I] Average on 10 runs - GPU latency: 9.53646 ms - Host latency: 10.2664 ms (end to end 18.9249 ms, enqueue 1.71501 ms)
[11/28/2022-01:21:54] [I] Average on 10 runs - GPU latency: 9.52363 ms - Host latency: 10.2317 ms (end to end 18.9418 ms, enqueue 1.7092 ms)
[11/28/2022-01:21:54] [I] Average on 10 runs - GPU latency: 9.53206 ms - Host latency: 10.3252 ms (end to end 18.9318 ms, enqueue 1.81809 ms)
[11/28/2022-01:21:54] [I] Average on 10 runs - GPU latency: 9.54126 ms - Host latency: 10.3066 ms (end to end 18.955 ms, enqueue 1.74968 ms)
[11/28/2022-01:21:54] [I] Average on 10 runs - GPU latency: 9.53682 ms - Host latency: 10.2862 ms (end to end 18.9652 ms, enqueue 1.90947 ms)
[11/28/2022-01:21:54] [I] Average on 10 runs - GPU latency: 9.54568 ms - Host latency: 10.2775 ms (end to end 18.9686 ms, enqueue 1.80266 ms)
[11/28/2022-01:21:54] [I] Average on 10 runs - GPU latency: 9.5314 ms - Host latency: 10.2373 ms (end to end 18.9275 ms, enqueue 1.78276 ms)
[11/28/2022-01:21:54] [I] Average on 10 runs - GPU latency: 9.52163 ms - Host latency: 10.1887 ms (end to end 18.9425 ms, enqueue 1.57297 ms)
[11/28/2022-01:21:54] [I] Average on 10 runs - GPU latency: 9.52212 ms - Host latency: 10.3199 ms (end to end 18.9362 ms, enqueue 1.8717 ms)
[11/28/2022-01:21:54] [I] Average on 10 runs - GPU latency: 9.5271 ms - Host latency: 10.2847 ms (end to end 18.9282 ms, enqueue 1.7677 ms)
[11/28/2022-01:21:54] [I] Average on 10 runs - GPU latency: 9.52407 ms - Host latency: 10.2297 ms (end to end 18.9578 ms, enqueue 1.63486 ms)
[11/28/2022-01:21:54] [I] Average on 10 runs - GPU latency: 9.52361 ms - Host latency: 10.3314 ms (end to end 18.9119 ms, enqueue 1.82637 ms)
[11/28/2022-01:21:54] [I]
[11/28/2022-01:21:54] [I] === Performance summary ===
[11/28/2022-01:21:54] [I] Throughput: 98.1751 qps
[11/28/2022-01:21:54] [I] Latency: min = 10.1248 ms, max = 15.7787 ms, mean = 10.3718 ms, median = 10.312 ms, percentile(99%) = 10.9131 ms
[11/28/2022-01:21:54] [I] End-to-End Host Latency: min = 18.8291 ms, max = 170.617 ms, mean = 19.6443 ms, median = 19.0472 ms, percentile(99%) = 20.5318 ms
[11/28/2022-01:21:54] [I] Enqueue Time: min = 1.34326 ms, max = 2.96362 ms, mean = 1.78289 ms, median = 1.66577 ms, percentile(99%) = 2.81873 ms
[11/28/2022-01:21:54] [I] H2D Latency: min = 0.53125 ms, max = 4.94424 ms, mean = 0.646486 ms, median = 0.560547 ms, percentile(99%) = 1.05811 ms
[11/28/2022-01:21:54] [I] GPU Compute Time: min = 9.46582 ms, max = 10.7348 ms, mean = 9.62432 ms, median = 9.57275 ms, percentile(99%) = 10.1919 ms
[11/28/2022-01:21:54] [I] D2H Latency: min = 0.0830078 ms, max = 0.165771 ms, mean = 0.100955 ms, median = 0.0949707 ms, percentile(99%) = 0.150879 ms
[11/28/2022-01:21:54] [I] Total Host Walltime: 3.04558 s
[11/28/2022-01:21:54] [I] Total GPU Compute Time: 2.87767 s
[11/28/2022-01:21:54] [I] Explanations of the performance metrics are printed in the verbose logs.注意:Throughput:越大代表吞吐量越大,模型推理速度越快
查看end-end数值也是可以的。
我对比只用--int8参数的:
trtexec.exe --onnx=yolov5n_ptq_detect_dynamic.onnx --saveEngine=ptq_int8_fp16.trtmodel --int8=== Trace details ===
[11/28/2022-01:26:45] [I] Trace averages of 10 runs:
[11/28/2022-01:26:45] [I] Average on 10 runs - GPU latency: 11.9224 ms - Host latency: 12.9673 ms (end to end 26.5488 ms, enqueue 1.62947 ms)
[11/28/2022-01:26:45] [I] Average on 10 runs - GPU latency: 11.5994 ms - Host latency: 12.2361 ms (end to end 23.1969 ms, enqueue 1.63635 ms)
[11/28/2022-01:26:45] [I] Average on 10 runs - GPU latency: 11.5977 ms - Host latency: 12.2426 ms (end to end 23.1557 ms, enqueue 1.73348 ms)
[11/28/2022-01:26:45] [I] Average on 10 runs - GPU latency: 11.5168 ms - Host latency: 12.1538 ms (end to end 22.9547 ms, enqueue 1.61493 ms)
[11/28/2022-01:26:45] [I] Average on 10 runs - GPU latency: 11.4802 ms - Host latency: 12.1185 ms (end to end 22.8907 ms, enqueue 1.57255 ms)
[11/28/2022-01:26:45] [I] Average on 10 runs - GPU latency: 11.4798 ms - Host latency: 12.1063 ms (end to end 22.914 ms, enqueue 1.53058 ms)
[11/28/2022-01:26:45] [I] Average on 10 runs - GPU latency: 11.4603 ms - Host latency: 12.0941 ms (end to end 22.844 ms, enqueue 1.54984 ms)
[11/28/2022-01:26:45] [I] Average on 10 runs - GPU latency: 11.4718 ms - Host latency: 12.1083 ms (end to end 22.8685 ms, enqueue 1.54115 ms)
[11/28/2022-01:26:45] [I] Average on 10 runs - GPU latency: 11.4479 ms - Host latency: 12.0782 ms (end to end 22.8271 ms, enqueue 1.56331 ms)
[11/28/2022-01:26:45] [I] Average on 10 runs - GPU latency: 11.5097 ms - Host latency: 12.1481 ms (end to end 22.9363 ms, enqueue 1.56982 ms)
[11/28/2022-01:26:45] [I] Average on 10 runs - GPU latency: 11.4952 ms - Host latency: 12.1253 ms (end to end 22.9465 ms, enqueue 1.55604 ms)
[11/28/2022-01:26:45] [I] Average on 10 runs - GPU latency: 11.4569 ms - Host latency: 12.0909 ms (end to end 22.8553 ms, enqueue 1.53179 ms)
[11/28/2022-01:26:45] [I] Average on 10 runs - GPU latency: 11.4589 ms - Host latency: 12.1097 ms (end to end 22.8795 ms, enqueue 1.60232 ms)
[11/28/2022-01:26:45] [I] Average on 10 runs - GPU latency: 11.4927 ms - Host latency: 12.1319 ms (end to end 22.9371 ms, enqueue 1.61584 ms)
[11/28/2022-01:26:45] [I] Average on 10 runs - GPU latency: 11.4897 ms - Host latency: 12.1287 ms (end to end 22.937 ms, enqueue 1.60978 ms)
[11/28/2022-01:26:45] [I] Average on 10 runs - GPU latency: 11.4534 ms - Host latency: 12.0859 ms (end to end 22.8126 ms, enqueue 1.55414 ms)
[11/28/2022-01:26:45] [I] Average on 10 runs - GPU latency: 11.4507 ms - Host latency: 12.0853 ms (end to end 22.8174 ms, enqueue 1.50864 ms)
[11/28/2022-01:26:45] [I] Average on 10 runs - GPU latency: 11.4556 ms - Host latency: 12.0889 ms (end to end 22.8299 ms, enqueue 1.54136 ms)
[11/28/2022-01:26:45] [I] Average on 10 runs - GPU latency: 11.441 ms - Host latency: 12.0763 ms (end to end 22.8039 ms, enqueue 1.48589 ms)
[11/28/2022-01:26:45] [I] Average on 10 runs - GPU latency: 11.4657 ms - Host latency: 12.1066 ms (end to end 22.8564 ms, enqueue 1.55193 ms)
[11/28/2022-01:26:45] [I] Average on 10 runs - GPU latency: 11.467 ms - Host latency: 12.1061 ms (end to end 22.816 ms, enqueue 1.56992 ms)
[11/28/2022-01:26:45] [I] Average on 10 runs - GPU latency: 11.4546 ms - Host latency: 12.091 ms (end to end 22.8033 ms, enqueue 1.5084 ms)
[11/28/2022-01:26:45] [I] Average on 10 runs - GPU latency: 11.4535 ms - Host latency: 12.0993 ms (end to end 22.8176 ms, enqueue 1.61626 ms)
[11/28/2022-01:26:45] [I] Average on 10 runs - GPU latency: 11.4425 ms - Host latency: 12.0855 ms (end to end 22.7886 ms, enqueue 1.52632 ms)
[11/28/2022-01:26:45] [I] Average on 10 runs - GPU latency: 11.4571 ms - Host latency: 12.0936 ms (end to end 22.8192 ms, enqueue 1.61838 ms)
[11/28/2022-01:26:45] [I] Average on 10 runs - GPU latency: 11.4402 ms - Host latency: 12.0712 ms (end to end 22.821 ms, enqueue 1.50779 ms)
[11/28/2022-01:26:45] [I]
[11/28/2022-01:26:45] [I] === Performance summary ===
[11/28/2022-01:26:45] [I] Throughput: 85.541 qps
[11/28/2022-01:26:45] [I] Latency: min = 12.0249 ms, max = 17.3826 ms, mean = 12.1473 ms, median = 12.0969 ms, percentile(99%) = 12.6057 ms
[11/28/2022-01:26:45] [I] End-to-End Host Latency: min = 22.6846 ms, max = 52.0965 ms, mean = 23.0261 ms, median = 22.8641 ms, percentile(99%) = 24.234 ms
[11/28/2022-01:26:45] [I] Enqueue Time: min = 1.37061 ms, max = 2.40161 ms, mean = 1.57101 ms, median = 1.54297 ms, percentile(99%) = 1.99091 ms
[11/28/2022-01:26:45] [I] H2D Latency: min = 0.52832 ms, max = 4.58092 ms, mean = 0.559679 ms, median = 0.539001 ms, percentile(99%) = 0.637695 ms
[11/28/2022-01:26:45] [I] GPU Compute Time: min = 11.4016 ms, max = 12.7121 ms, mean = 11.4946 ms, median = 11.459 ms, percentile(99%) = 11.9795 ms
[11/28/2022-01:26:45] [I] D2H Latency: min = 0.0827026 ms, max = 0.121033 ms, mean = 0.0929625 ms, median = 0.0922852 ms, percentile(99%) = 0.116089 ms
[11/28/2022-01:26:45] [I] Total Host Walltime: 3.03948 s
[11/28/2022-01:26:45] [I] Total GPU Compute Time: 2.98861 s
[11/28/2022-01:26:45] [I] Explanations of the performance metrics are printed in the verbose logs.通过以上Throughput或者end-end数值对比,可以看到使用--int8 --fp16的速度明显快于
--int8(实际是--int8 + fp32)。这样也就符合我们的预期了!
(3)为engine画图
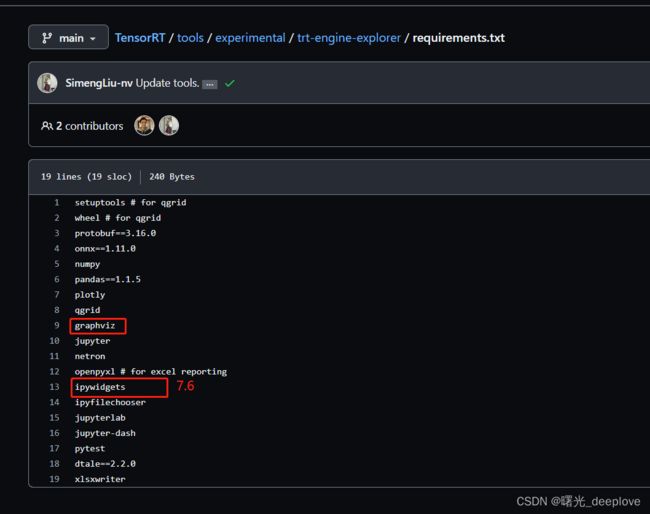
这些要安装在conda虚拟环境下面
另外注意trex安装(要在虚拟环境下面):
git clone https://github.com/NVIDIA/TensorRT.git
cd TensorRT/tools/experimental/trt-engine-explorer
python -m pip install -e .
运行命令:
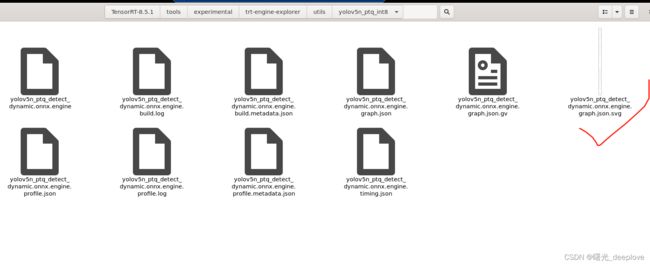
(yolo) wt-yjy@vt82-NF5468M6:~/TensorRT-8.5.1/tools/experimental/trt-engine-explorer/utils$ python process_engine.py yolov5n_ptq_detect_dynamic.onnx yolov5n_ptq_int8 int8 fp16
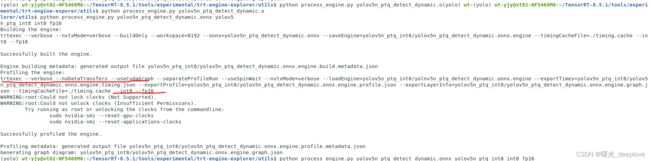
同时使用了int8和fp16来生成engine
使用浏览器打开svg如下:
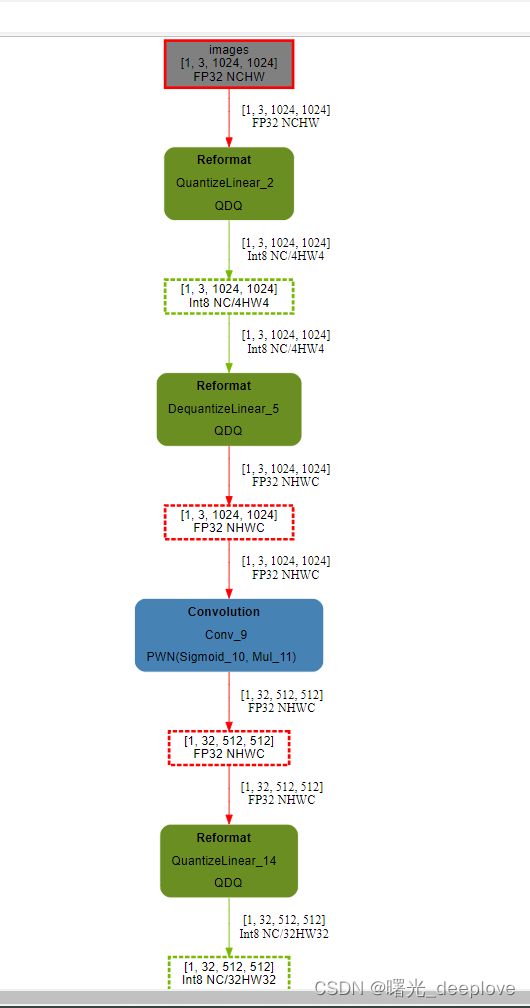
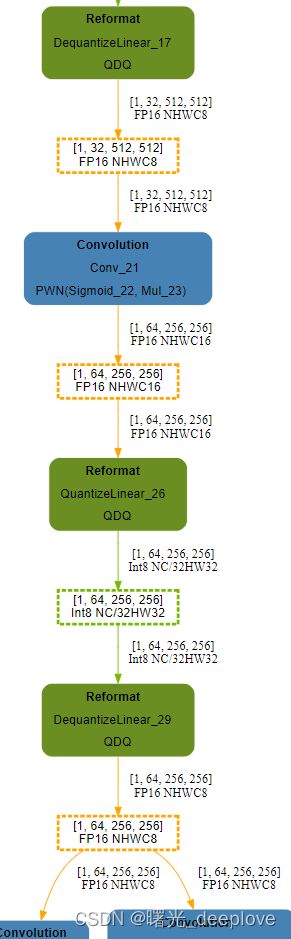
只展示如上的示意图。可以看到这个engine中包含了int8+fp16+少量的fp32
,如果我们只是用int8生成的engine呢?我们可以看下:
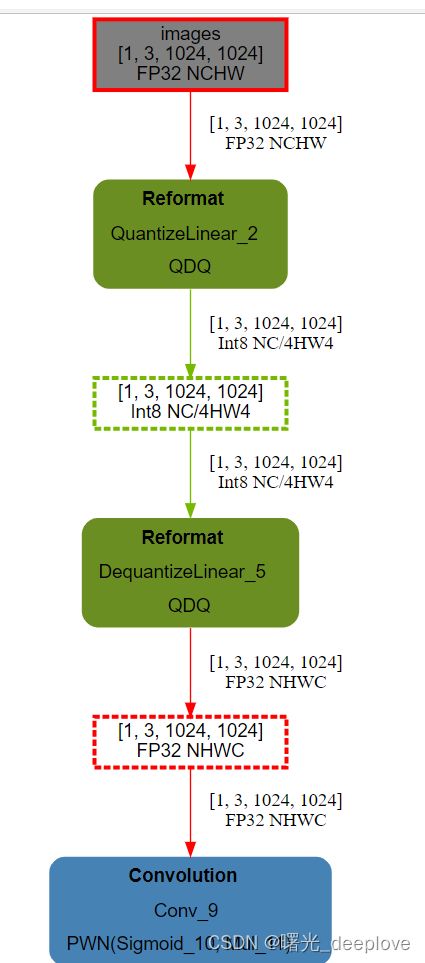
明显可以看到,我们int8的engine中显示图中只有fp32和int8的算子。
注意:上面的可以使用process_engine.py来画,也可以使用draw_engine.py来画
(4)画出各个engine的性能图
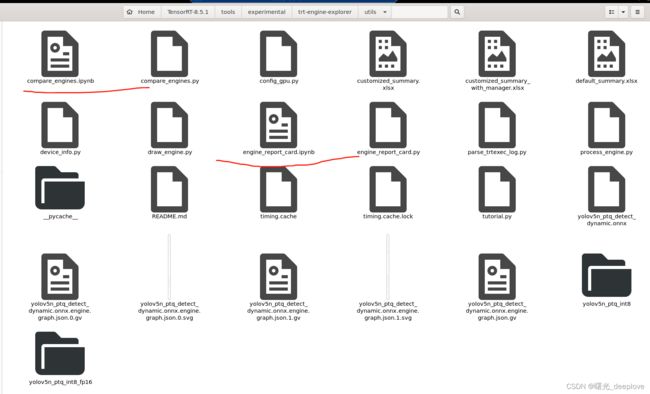
利用这两个jupyter文件
首先看compare_engine:
import IPython
from ipywidgets import widgets
from trex import *


# Configure a wider output (for the wide graphs)
set_wide_display()

engine_name_1 = "./yolov5n_ptq_int8/yolov5n_ptq_detect_dynamic.onnx.engine"
engine_name_2 = "./yolov5n_ptq_int8_fp16/yolov5n_ptq_detect_dynamic.onnx.engine"

plan1 = EnginePlan(f'{engine_name_1}.graph.json', f'{engine_name_1}.profile.json', f"{engine_name_1}.profile.metadata.json")
plan2 = EnginePlan(f'{engine_name_2}.graph.json', f'{engine_name_2}.profile.json', f"{engine_name_2}.profile.metadata.json")
plans = (plan1, plan2)

compare_engines_summaries_tbl(plans, orientation='vertical')
compare_engines_overview(plans)

compare_engines_layer_latencies(
    plan1, plan2,
    # Allow for 3% error grace threshold when color highlighting performance differences
    threshold=0.03,
    # Inexact matching uses only the layer's first input and output to match to other layers.
    exact_matching=True)

compare_engines_layer_details(plans[0], plans[1])
report_card_perf_overview_widget(plan1);
print(plan1.name)


report_card_perf_overview_widget(plan2);
print(plan2.name)


report_card_table_view(plan1);
print(plan1.name)


report_card_table_view(plan2);
print(plan2.name)


for plan in plans:
    graph = to_dot(plan, layer_type_formatter, display_regions=True, expand_layer_details=True)
    render_dot(graph, plan.name, 'svg')
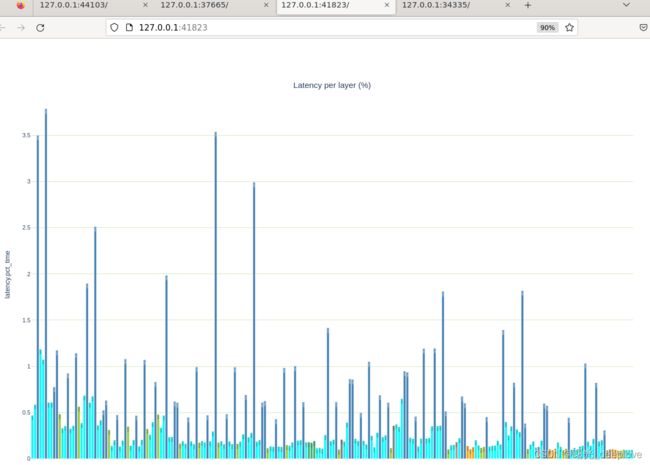
随便展示图如下:

engine_report_card:
import IPython
from ipywidgets import widgets
from trex import *

# Choose an engine file to load.
engine_name = "./yolov5n_ptq_int8/yolov5n_ptq_detect_dynamic.onnx.engine"
engine_name = "./yolov5n_ptq_int8_fp16/yolov5n_ptq_detect_dynamic.onnx.engine"

set_wide_display()

plan = EnginePlan(f"{engine_name}.graph.json", f"{engine_name}.profile.json", f"{engine_name}.profile.metadata.json")

report_card_draw_plan_graph_extended(plan, engine_name)


# "Average time" refers to the sum of the layer latencies, when profiling layers separately
# "Latency" refers to the [min, max, mean, median, 99% percentile] of the engine latency measurements, when timing the engine w/o profiling layers.
plan.summary()

layer_latency_sunburst(plan.df, "Layers Latencies (%)")

report_card_table_view(plan)

plot_engine_timings(timing_json_file= f"{engine_name}.timing.json")

report_card_perf_overview_widget(plan);

report_card_memory_footprint_widget(plan);

convs = plan.get_layers_by_type('Convolution')
report_card_convolutions_overview_widget(convs)

latency_vs_prec_per_conv = partial(
    plotly_bar2,
    convs,
    values_col='latency.pct_time',
    names_col='Name',
    color='tactic')

latency_vs_prec_per_conv("Latency per Layer (color=Tactics)")

tactic_cnt = group_count(plan.df, 'tactic')
display_df(tactic_cnt)


report_card_gemm_MNK(plan);
report_card_gemm_MNK_scatter(plan);
report_card_efficiency_vs_latency_3d(plan);
report_card_perf_scatter(plan);
display_df(ConvLinter(plan).lint())
report_card_reformat_overview(plan)
display_df(ReformatLinter(plan).lint())
display_df(SliceLinter(plan).lint())
display_df(QDQLinter(plan).lint())
report_card_pointwise_lint(plan)

summary = ExcelSummary(plan, path="default_summary.xlsx")
summary.generate_default_summary() # 'generate_default_summary' automatically saves the file


summary = ExcelSummary(plan, path="customized_summary.xlsx")
summary.add_dataframes({"df": plan.df})
summary.add_images({"trex_logo": "../images/trex_logo.png"})
summary.add_dataframes({"clean_df": clean_for_display(plan.df)})
summary.save() # 'save' needs to be called to propagate the changes to the file

# The context manager automatically saves the file
with ExcelSummary(plan, path="customized_summary_with_manager.xlsx") as summary:
    summary.add_dataframes({"df": plan.df})
    summary.add_images({"trex_logo": "../images/trex_logo.png"})
    summary.add_dataframes({"clean_df": clean_for_display(plan.df)})
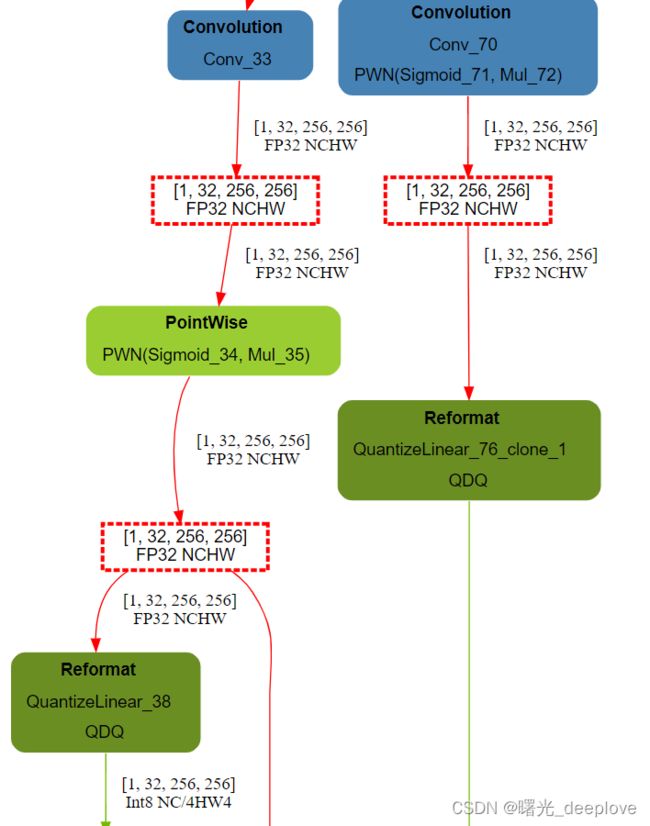
展示部分图如下:
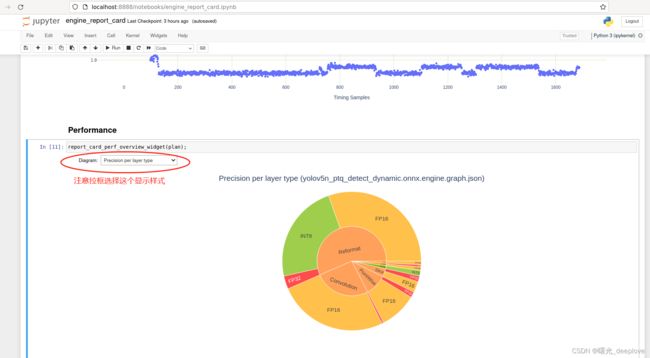
可以看到整个跟我们前面的也是符合一致的,前面使用了int8和fp16转换后,仍然存在少量部分fp32的算子操作。
注意:以上是PTQ的量化结果。