Machine Learning with Graphs 之 Traditional Methods for Machine Learning in Graphs
文章目录
- 一、 Overview
- 二、Node Level Tasks and Features
-
- 2.1 overview
- 2.2 Node degree
- 2.3 Node Centrality
-
- Eigenvector centrality
- Betweenness centrality
- Closeness centrality
- 2.4 Clustering Coefficient
- 2.5 Graphlets
- 2.6 Summary
- 三、Link Prediction Tasks and Features
-
- 3.1 overview
- 3.2 Distance-based feature
- 3.3 Local Neighborhood Overlap
- 3.4 Global Neighborhood Overlap
- 3.5 Summary
- 四、Graph Level Features
-
- 4.1 Overview
- 4.2 Graphlet kernel features
- 4.3 WL Kernel features
一、 Overview
下面内容摘自:https://uvadlc-notebooks.readthedocs.io/en/latest/tutorial_notebooks/tutorial7/GNN_overview.html
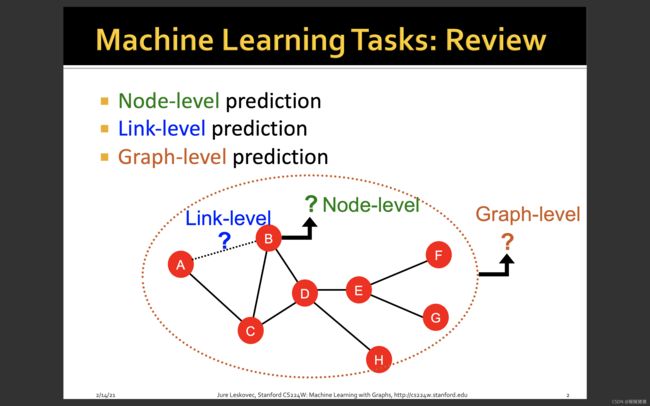
Node-level tasks: Semi-supervised node classification
Node-level tasks have the goal to classify nodes in a graph. Usually, we have given a single, large graph with >1000 nodes of which a certain amount of nodes are labeled. We learn to classify those labeled examples during training and try to generalize to the unlabeled nodes.
Edge-level tasks: Link prediction
In some applications, we might have to predict on an edge-level instead of node-level. The most common edge-level task in GNN is link prediction. Link prediction means that given a graph, we want to predict whether there will be/should be an edge between two nodes or not. For example, in a social network, this is used by Facebook and co to propose new friends to you. Again, graph level information can be crucial to perform this task. The output prediction is usually done by performing a similarity metric on the pair of node features, which should be 1 if there should be a link, and otherwise close to 0.
Graph-level tasks: Graph classification
The goal is to classify an entire graph instead of single nodes or edges. Therefore, we are also given a dataset of multiple graphs that we need to classify based on some structural graph properties. The most common task for graph classification is molecular property prediction, in which molecules are represented as graphs. Each atom is linked to a node, and edges in the graph are the bonds between atoms. For example, look at the figure below.

On the left, we have an arbitrary, small molecule with different atoms, whereas the right part of the image shows the graph representation. The atom types are abstracted as node features (e.g. a one-hot vector), and the different bond types are used as edge features. For simplicity, we will neglect the edge attributes in this tutorial, but you can include by using methods like the Relational Graph Convolution that uses a different weight matrix for each edge type.
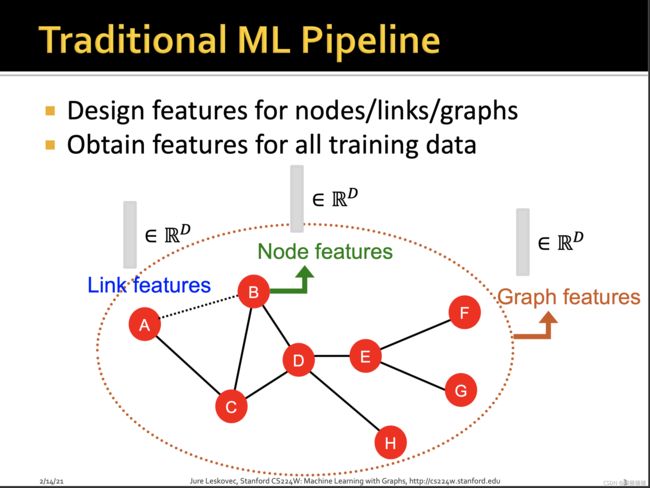

对于传统的机器学习而言,其pipeline,首先需要做的就是设计特征,然后根据设计的特征,对所有训练数据进行特征抽取,进行训练,而对于graph这种数据结构而言,所设计的特征自底向上可以包括但不仅仅限于Node features, Link features, Graph feature,具体采用的模型,可以包括随机森林,SVM,神经网络等,然后利用训练好的模型,对新的node,link,graph进行预测。
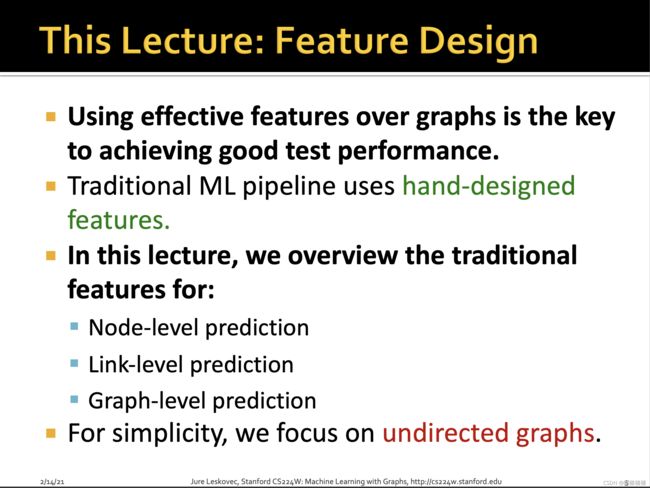


cs224w第二讲的主要内容就是在针对graph进行特征设计,针对node level, link level和graph level设计不同的手工特征,为了简洁,本章主要关注于无向图。针对不同level的object,抽取特征来进行相应任务的预测。
二、Node Level Tasks and Features
2.1 overview

上图是在已知部分node的状态的情况下,针对其他未知node进行分类预测。可以发现,绿色node的degree >= 2而红色node的degree = 1,如果利用节点degree的特征,能很好地对该graph node进行分类。

而对于nodel-level features而言,它的主要目标是刻画一个节点在graph or network中的位置以及结构,因此常用的特征包括:
- Node degree
- Node centrality
- Clustering coefficient
- Graphlets
2.2 Node degree
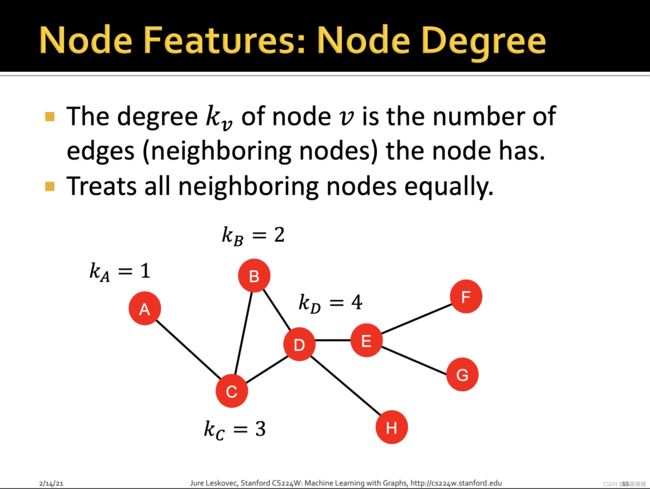
度:即一个node与之相连接的邻居node(边)的数目,其对所有邻居node一视同仁,不加以差别对待,比如C和E的度都是3,因此其具备相同的特征,模型会不加以区分,预测出同样的结果,同理A,H,G,F的度都是1,因此其也具备同样的node degree feature。
2.3 Node Centrality

node degrees并不考虑邻居node的重要性,而node centrality即节点中心性用来刻画某个node在整个网络中的重要程度如何,其将graph中node的重要性程度考虑在内。刻画centrality有以下几种方式:
- Engienvector centrality
- Betweenness centrality
- Closeness centrality
- and many others
Eigenvector centrality

如果认为邻居节点重要,则该节点自身也重要,即近朱者赤近墨者黑,因此节点 v v v的中心度是所有邻居节点的中心度加和。
c v = 1 λ ∑ u ∈ N ( v ) c u c_v = \frac{1}{\lambda}\sum_{u\in N(v)} c_u cv=λ1u∈N(v)∑cu
其中 λ \lambda λ是某个正的常数,
这是一个递归式,即node之间彼此依赖,因此将其转化为矩阵的形式
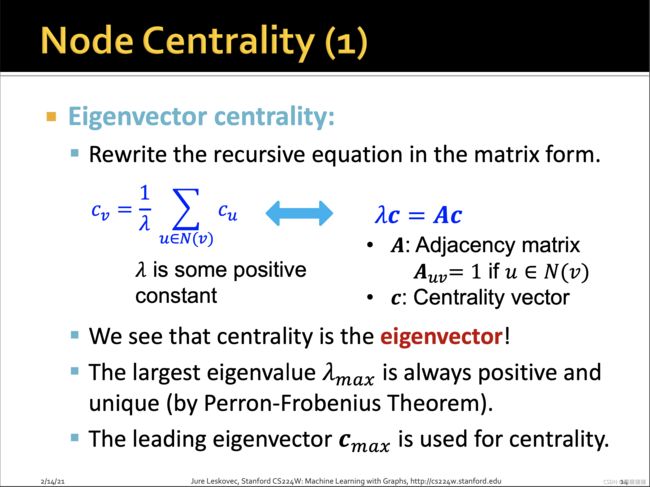
c v = 1 λ ∑ u ∈ N ( v ) c u < − − − − > λ c = A c c_v = \frac{1}{\lambda}\sum_{u\in N(v)} c_u <----> \lambda c = Ac cv=λ1u∈N(v)∑cu<−−−−>λc=Ac
其中A是graph的邻接矩阵表示形式,即如果 u u u与 v v v相邻,则 A u v = 1 A_{uv}=1 Auv=1,否则为0。从上式可以发现,所谓的中心度其实就是特征向量, λ \lambda λ就是相应的特征值。根据perron-frobenius定理,对于一个非负方阵,它的最大的特征值 λ m a x \lambda_{max} λmax总是正数,且唯一,因此这儿,将与之对应的特征向量 c m a x c_{max} cmax用以表明中心度。
N 维非零向量 v 是 N×N 的矩阵 A 的特征向量,当且仅当下式成立: λ c = A c \lambda c = Ac λc=Ac,其中 λ \lambda λ 为一标量,称为 v 对应的特征值。也称 v 为特征值 λ \lambda λ 对应的特征向量。也即特征向量被施以线性变换 A 只会使向量伸长或缩短而其方向不被改变。
为了更好地说明eigen centrality,参考:https://www.youtube.com/watch?v=Fr-KK8Ks5vg

即流程就是根据邻接矩阵,得到特征值,其中最大的特征值就是 λ \lambda λ,其对应的特征向量就是中心度向量,然后对向量进行归一化,即最大的值为1,那么对于一个节点数目为 n n n的graph,会得到一个n维的中心度向量,然后其中每一个元素就是每个节点与之相对应的中心度值,可以看到的是node 4的值最高,说明其重要度最高,因为它与三个节点相连接,而节点6虽然度也为3但是重要度不如节点4,重要性最低的是节点1,处于边缘的度为1的节点。


在一个小的network中,即使只经过5个step的迭代,依旧能使得得到的向量与特征向量很接近。
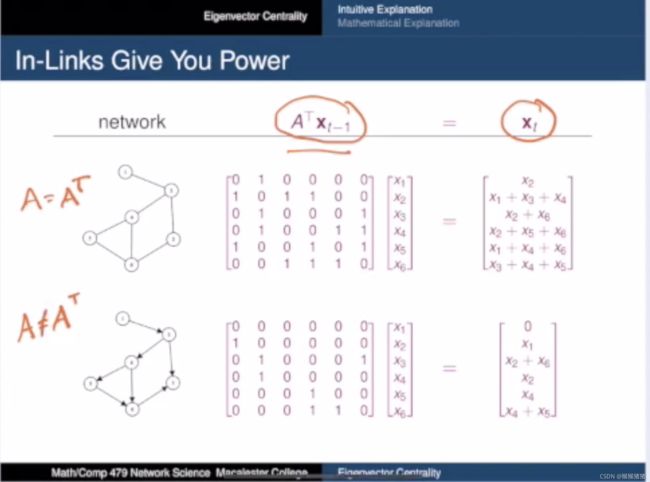
实对称矩阵的性质:
1、实对称矩阵A的不同特征值对应的特征向量是正交的。
2、实对称矩阵A的特征值都是实数,特征向量都是实向量。
3、n阶实对称矩阵A必可对角化,且相似对角阵上的元素即为矩阵本身特征值。
4、若λ0具有k重特征值,必有k个线性无关的特征向量,或者说必有秩r(λ0E-A)=n-k,其中E为单位矩阵。
特征分解(Eigendecomposition),又称谱分解(Spectral decomposition)是将矩阵分解为由其特征值和特征向量表示的矩阵之积的方法。需要注意只有对可对角化矩阵才可以施以特征分解。
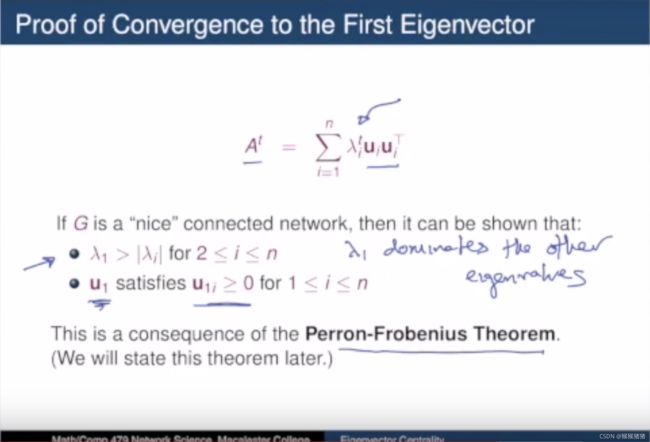
这样 λ 1 \lambda_1 λ1是最大的特征值,因此在所有特征值中占据支配地位,且 u 1 u_1 u1中的所有值都>=0。【Perron-Frobenius Theorem】

上述talk其实并没有具体证明perron-frobenius定理,而是具体阐释eigenvector centrality的意义与流程。
Betweenness centrality
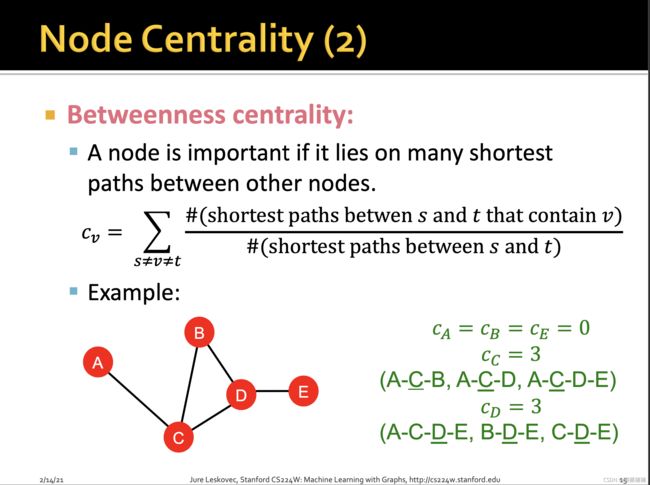
中介中心度,计算经过一个点的最短路径的数量。经过一个点的最短路径的数量越多,就说明它的中介中心度越高。
中介中心性指的是一个结点担任其它两个结点之间最短路的桥梁的次数。一个结点充当“中介”的次数越高,它的中介中心度就越大。如果要考虑标准化的问题,可以用一个结点承担最短路桥梁的次数除以所有的路径数量。
https://www.zhihu.com/question/22610633/answer/143644471
比如这张图里面,A,B,E的中介中心度是0,因为没有两个节点的最短路径是要经过这些node的,A,E是因为是边缘degree为1的节点,B虽然有两个邻居节点,但是C到D直接一步就到了,经过B反而绕路了,所以B并没有承担过最短路径桥梁的作用。
相反,对于节点C而言,A-C-B, A-C-D, A-C-D-E都得经过C,所以其充当最短路桥梁的次数为3,同理D也是3。
Closeness centrality

接近中心度,计算的是一个点到其他所有点的距离的总和,这个总和越小就说明这个点到其他所有点的路径越短,也就说明这个点距离其他所有点越近。接近中心度体现的是一个点(node)与其他点的近邻程度。接近中心性的值为路径长度的倒数。
比如你要建一个大型的娱乐商场,你可能会希望周围的顾客到达这个商场的距离都可以尽可能地短。这个就涉及到接近中心性的概念,接近中心性的值为路径长度的倒数。接近中心性需要考量每个结点到其它结点的最短路的平均长度。也就是说,对于一个结点而言,它距离其它结点越近,那么它的中心度越高。一般来说,那种需要让尽可能多的人使用的设施,它的接近中心度一般是比较高的。
https://www.zhihu.com/question/22610633/answer/143644471
具体计算流程如上所示。
2.4 Clustering Coefficient
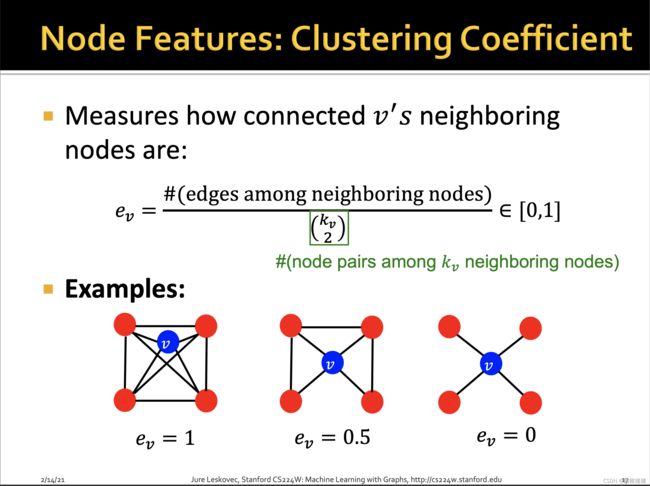
clustering coefficient (聚集系数),衡量节点邻居的连接程度
描述节点的局部结构信息。
即节点的邻居,是否彼此也有连接。分子是邻居有边连接的数目,分母是一个组合表示方式,即所有邻居可能存在的边的数目。因此上图的聚集系数分别为 6/6,3/6,0/6.
2.5 Graphlets
可以发现的是聚集系数其实是在计算三角形的数目,在社交网络之中会有很多这种三角形,因为可以想象你的朋友可能会经由你的介绍而认识,如果将triangle泛化为其他预定义的子图,称之为graphlets。

对于给定一定数目(k)的节点,存在 n k n_k nk个联通的异构子图,如3个节点产生的全连接异构子图只有如图所示的2个,4个点就只有6个。如果你再构建出新的子图形状,那么它一定跟其中某个子图是同构的。
https://blog.csdn.net/PolarisRisingWar/article/details/117336622
图中标的数字代表根节点可选的位置。例如对于 G 0 G_0 G0,两个节点是等价的,所以只有一种graphlet;对于 G 1 G_1 G1,根节点要么在中间要么在两边,上下两个边上的点是等价的,所以只有两种graphlet。其他的类似。节点数为2-5情况下一共能产生如图所示73种graphlet。这73个graphlet的核心概念就是不同的形状,不同的位置。
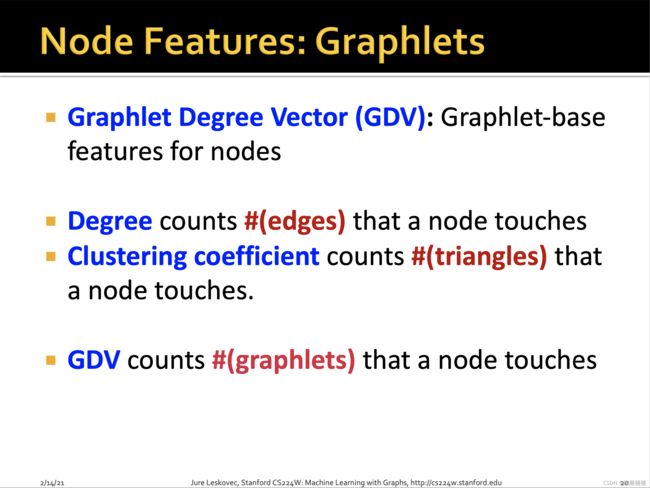
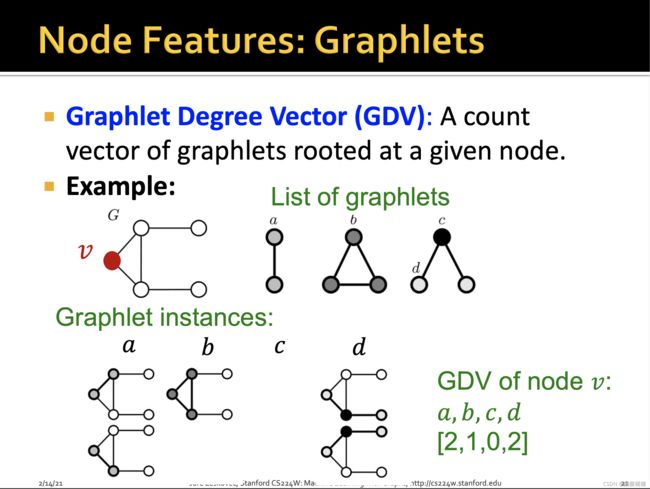
因此相较于degrree数边,聚集系数数三角形,graphlet degree vector数的就是各个graphlet的数目,如图,如果节点数目为<=3的话,会有四种类型的graphlets, a,b,c,d。
对于该节点 v v v而言,各个graphlet的数目分别为2,1,0,2,因此其GDV为[2,1,0,2]。
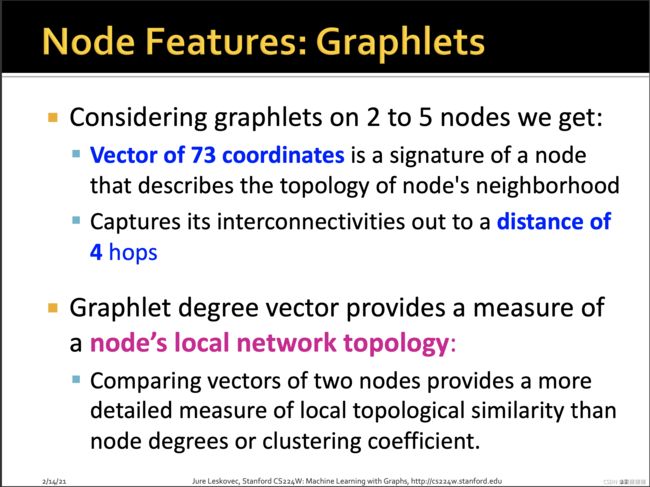
如果考虑2-5个节点的graphlets,就能得到一个73维度的GDV表征,描述该点的局部拓扑结构t,可以捕获距离为4 hops的互联性。相比节点度数或聚集系数,GDV能够描述两个节点之间更详细的节点局部拓扑结构相似性local topological similarity。
2.6 Summary


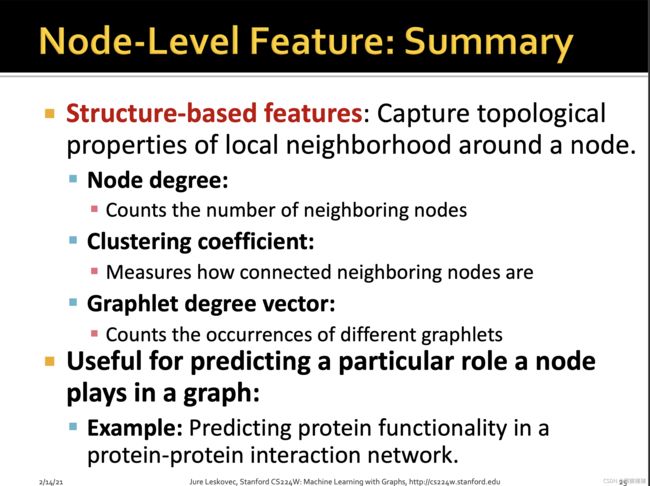
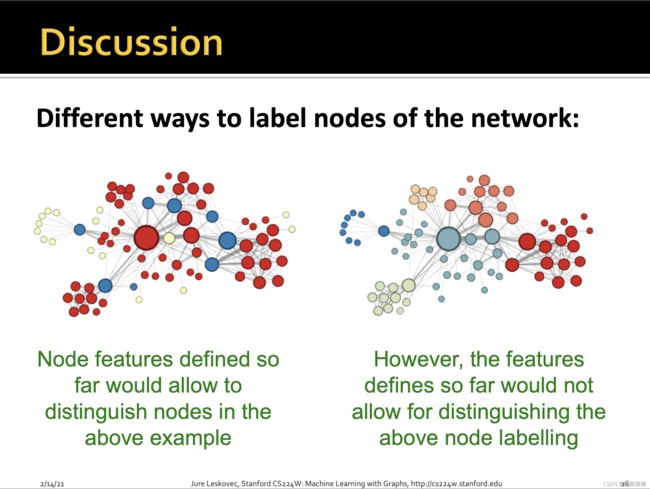 传统节点特征只能识别出结构上的相似,不能识别出图上空间、距离上的相似.
三、Link Prediction Tasks and Features
3.1 overview

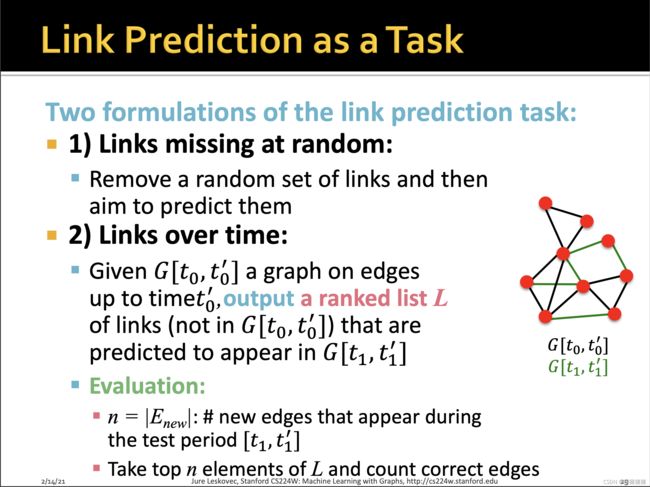
链接预测任务的两种类型:随机缺失边;随时间演化边
类型一:如author之间的coroperation或者论文之间的citation预测
类型二:如社交网络随时间演化,能认识更多朋友,或者知识图谱不停演化过程中,可能会生成一些新的边。

基于相似度得分来进行链接预测,相似度的衡量方式包括但是不限于计算公共邻居的数目。
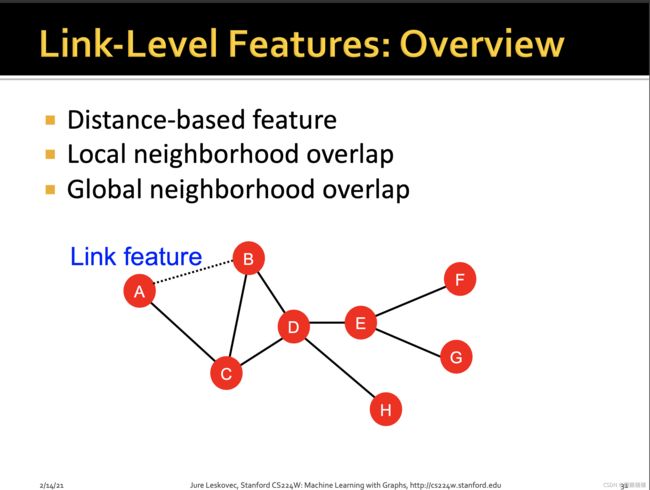
3.2 Distance-based feature
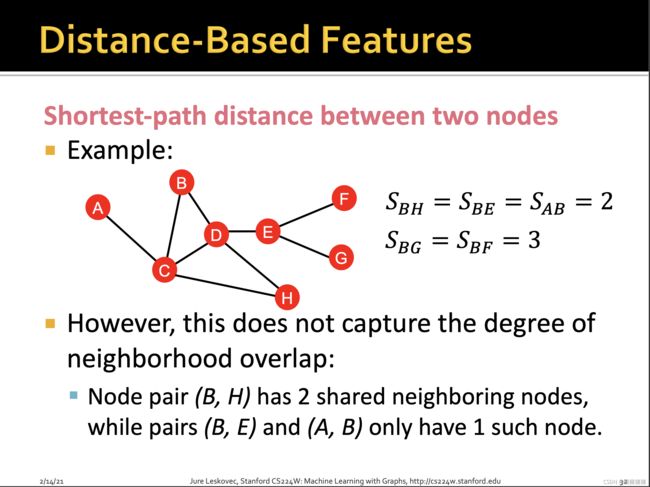
这种方式的问题在于没有考虑两个点邻居的重合度,如B-H有2个共同邻居,B-E和A-B都只有1个共同邻居。
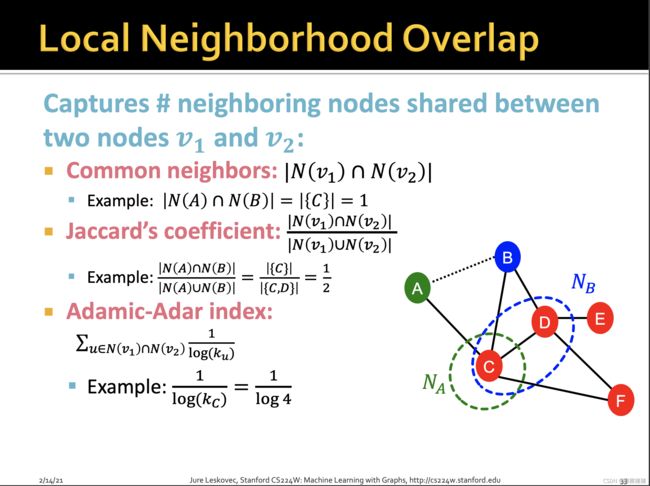
3.3 Local Neighborhood Overlap
common neighbors的问题在于度数高的点对就会有更高的结果,Jaccard’s coefficient是其归一化后的结果。Adamic-Adar index在实践中表现得好。在社交网络上表现好的原因:有一堆度数低的共同好友比有一堆名人共同好友的得分更高。

3.4 Global Neighborhood Overlap
局部邻居覆盖特征的局限性在于,如果两个节点没有邻居,那么其得分就永远为0,但是未来某一时刻其是有可能建立联系的,因此引入global neighborhood overlap。


Katz index:计算点对之间所有长度路径的条数。
计算方式:邻接矩阵求幂,邻接矩阵的k次幂结果,每个元素就是对应点对之间长度为k的路径的条数。

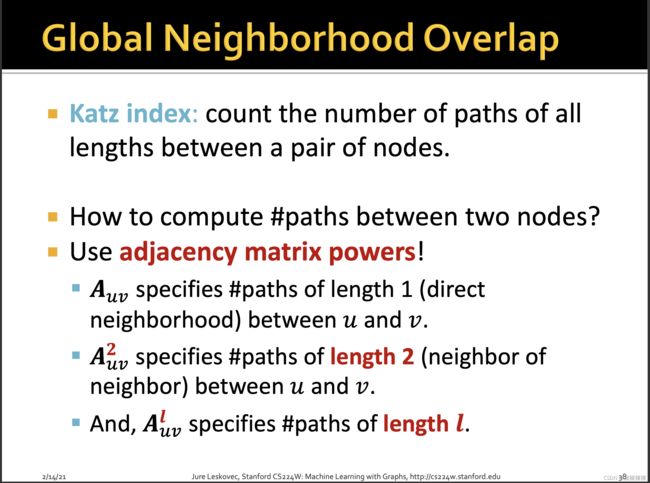

discount factor β \beta β 会给比较长的距离以比较小的权重,exponentially with their length.

https://blog.csdn.net/PolarisRisingWar/article/details/117336622
3.5 Summary

四、Graph Level Features
4.1 Overview

下面内容参考自:格拉姆矩阵(Gram matrix)详细解读
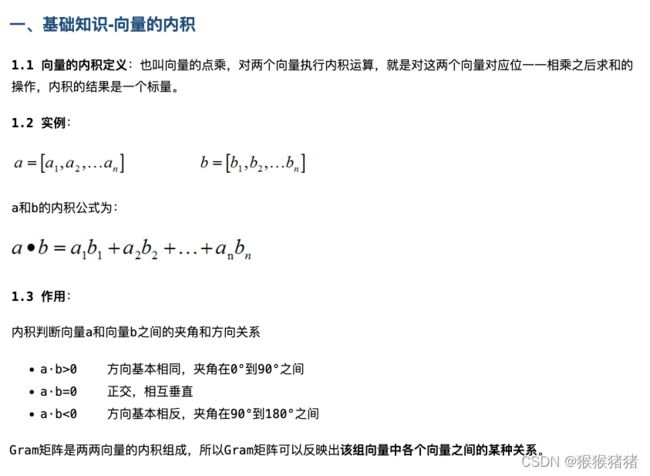

Gram矩阵及其半正定性
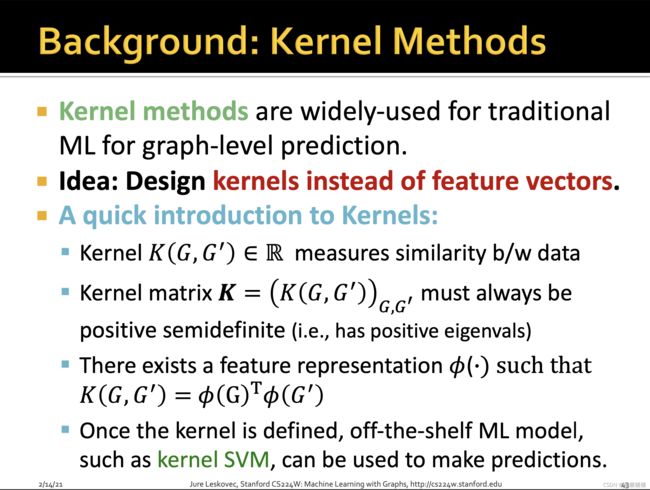
kernel martrix是半正定的方阵的,等价于它的特征值都是非负的,即存在正的特征值。机器学习中的核方法
【定义1】给定一个大小为 n × n n \times n n×n 的实对称矩阵 A A A ,若对于任意长度为 n n n 的非零向量 x x x ,有 x T A x > 0 x^{T}Ax > 0 xTAx>0 恒成立,则矩阵 A A A是一个正定矩阵。
【定义2】给定一个大小为 n × n n \times n n×n 的实对称矩阵 A A A ,若对于任意长度为 n n n 的非零向量 x x x ,有 x T A x > = 0 x^{T}Ax >= 0 xTAx>=0 恒成立,则矩阵 A A A是一个半正定矩阵。
https://zhuanlan.zhihu.com/p/81169491
所以正定矩阵是个什么意思呢?实际上就是说对于一个向量X,我们希望 X在经过有一个矩阵A的变化后得到的新的向量M和它本身的夹角小于90度。
而小于90度背后的含义是变换后的向量M是沿着原向量X的正方向进行缩放的(即 M投影回原向量时方向不变)。
而上面这句话还可以从特征向量的角度进一步理解,在介绍之前我们回顾一下特征值和特征向量的概念:

借用知乎https://zhuanlan.zhihu.com/p/81169491的例子,如果一个矩阵A为
[ 0.5 0 0 2 ] \begin{gathered} \begin{bmatrix} 0.5 & 0 \\ 0 & 2 \end{bmatrix} \end{gathered} [0.5002]
即两个特征值分别为0.5和2,其分别对应的特征向量是 [ 1 , 0 ] T [1,0]^T [1,0]T [ 0 , 1 ] T [0,1]^T [0,1]T。所以如果一个向量b左乘一个矩阵A,其本质就是将向量b沿着 [ 1 , 0 ] T [1,0]^T [1,0]T 和 [ 0 , 1 ] T [0,1]^T [0,1]T方向分别放大0.5和2倍。我们假设 b = [ 2 , 2 ] T b = [2,2]^T b=[2,2]T ,那么Ab最终得到的向量为 A b = [ 1 , 4 ] Ab = [1,4] Ab=[1,4] 。如果其中一个特征值小于0,比如 λ 1 < 0 \lambda_1 < 0 λ1<0那么最终得到的向量 Ab 投射到x轴方向的向量与 b 反向。综上,要使得变换后的向量M与原向量x夹角小于90度,即映射回原来的向量时保持方向不变,那么就需要特征值大于0,所以这也是为什么正定矩阵的特征值都大于0.
直观阐释如上图,数学证明如下:
x T A x = x T λ x = λ x T x = λ ∣ x ∣ 2 > 0 x^TA x = x^T\lambda x = \lambda x^Tx = \lambda |x|^2>0 xTAx=xTλx=λxTx=λ∣x∣2>0
所以得证,如果一个矩阵是正定方阵,等价于所有特征值都>0。
回到正题,所谓的kernel,你可以理解为衡量两个图相似度的函数,然后利用如svm内核化机器学习算法,能够直接在图上工作,而不需要进行特征提取可将其转化为特定长度的实值特征向量。存在特征向量 ϕ ( . ) \phi(.) ϕ(.)使得 K ( G , G ′ ) = ϕ ( G ) T ϕ ( G ′ ) K(G,G') = \phi(G)^T\phi(G') K(G,G′)=ϕ(G)Tϕ(G′)。一旦kernel定下来,就可以利用现成的模型,比如kernel svm来做预测。

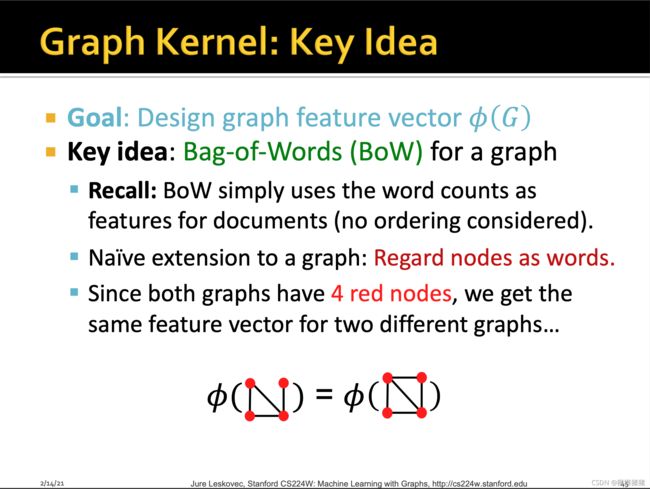
因此graph kenel的核心目标转化为设计graph feature vector ϕ ( G ) \phi(G) ϕ(G),其主要思路是利用BOW特征来表征一个graph,BOW即词袋特征是自然语言处理领域常用的特征,即统计文档里面单词出现的词频来当作单词的特征,没有考虑顺序。最直接的想法,就是把graph里面的node当作word。因此对于上图,尽管是两个不同的图,如果仅仅考虑红色节点的话,那么得到的特征向量是一致的。

那么如果我们将BOW中的W用node degree来代替呢,这样对于上面的图,我们就可以得到不同的表征。因此后面所提到的Graphlet Kernel以及weisfeiler-lehman kernel都用到形如Bag-of-*的形式,至于star所指的内容,往往比node degree要复杂得多。
4.2 Graphlet kernel features

graphlet features的核心思想就是数图中不同graphlet的数目,值得注意的是,这儿的graphlet与先前在node feature那儿定义有所区别。主要区别存在与:
[1] 这儿的graphlet不要求节点必须相连接,即可以存在孤立的node。
[2] graphlets不是rooted的,即不会因为你root处于graphlet中不同的位置,而视作不同的graphlet。具体例子如下图所示:
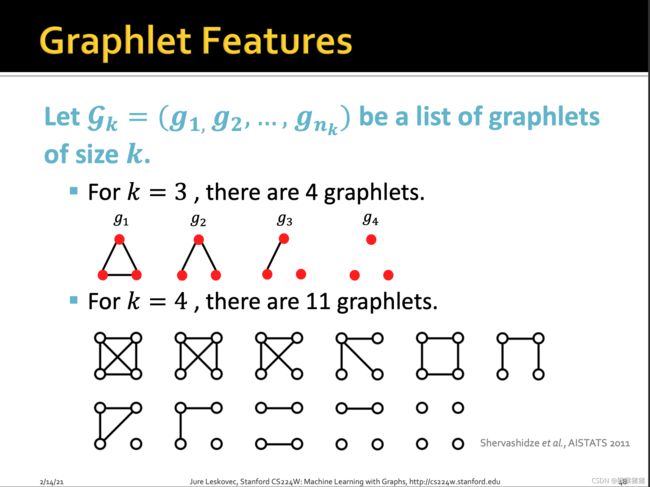
因此我们可以得到指定k的相应graphlet count vector f G f_G fG,它的维度等于 n k n_k nk即k个节点能组成的graphlet数目。

举例来说,对于k=3而言,下面的graph G可以被表征为 [ 1 , 3 , 6 , 0 ] T [1,3,6,0]^T [1,3,6,0]T的向量。

如果两个图,拥有不同的尺寸,那么直接进行点乘将会极大地skew the value,因此对向量先归一化,再相乘。

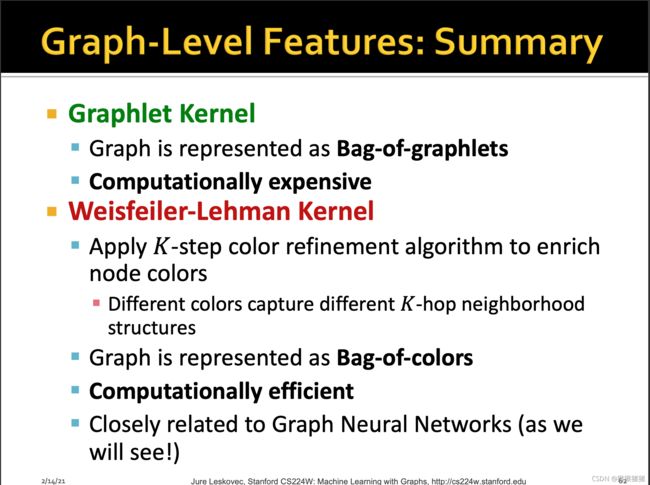
 缺点也显而易见,就是计算graphlets太耗时了。 子图同构是一个np hard问题。这儿的时间复杂度以及子图同构问题,下来待学习研究和补充。
4.3 WL Kernel features

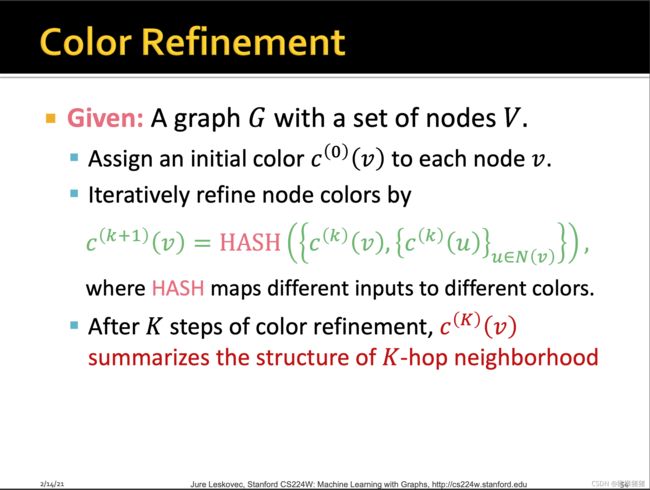
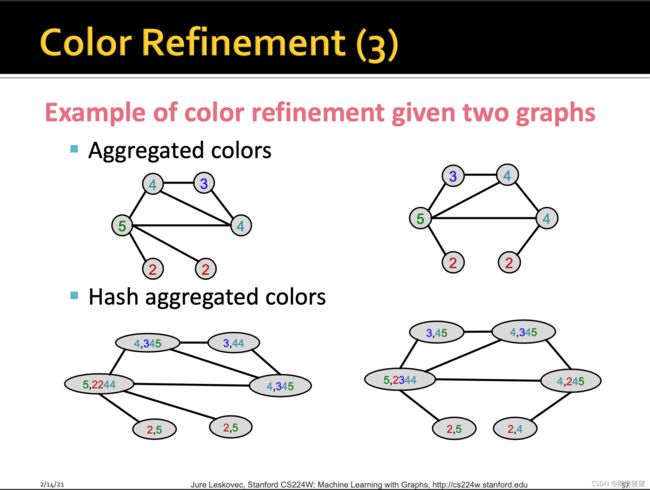
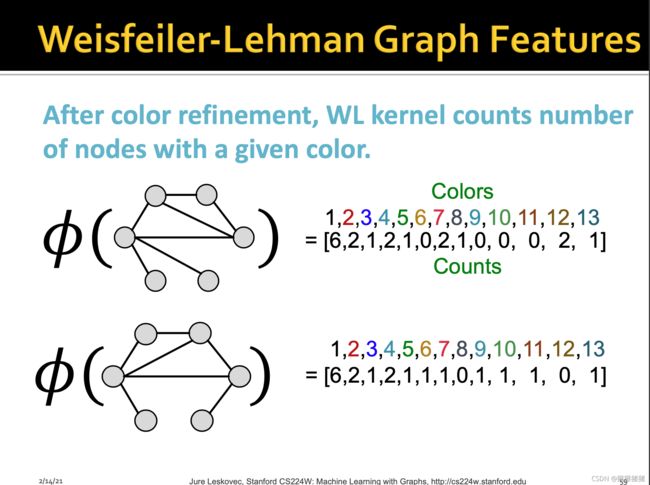
用节点邻居结构迭代地来扩充节点信息
