r语言随机森林_随机森林+时间序列(R语言版)
参考自: https://www.statworx.com/at/blog/time-series-forecasting-with-random-forest/
https://www.r-bloggers.com/tuning-random-forest-on-time-series-data/
知识点:
- 时间序列
- 随机森林
- log变换
- 差分
- Time delay embedding
- 评价指标
引言
With a few tricks, we can do time series forecasting with random forests. All it takes is a little pre- and (post-)processing. This blog post will show you how you can harness random forests for forecasting!
数据与数据处理
数据来源:German Statistical Office on the German wage and income tax revenue from 1999 - 2018(after tax redistribution). download link: here
数据预处理:
- Statistical transformations (Box-Cox transform, log transform, etc.)
- Detrending (differencing, STL, SEATS, etc.)
- Time Delay Embedding (more on this below)
- Feature engineering (lags, rolling statistics, Fourier terms, time dummies, etc.)
为了在随机森林上使用时间序列数据,我们做TDE,也就是:transform、difference and embed。
以下为R语言代码:
首先安装几个包:
install.packages("tidyverse")install.packages("tsibble")install.packages("randomForest")install.packages("forecast")然后就是导入数据,并转换数据的格式
# load the packagessuppressPackageStartupMessages(require(tidyverse))suppressPackageStartupMessages(require(tsibble))suppressPackageStartupMessages(require(randomForest))suppressPackageStartupMessages(require(forecast))# specify the csv file (your path here)file % select(-Type) %>% gather(Date, Value, -Year) %>% unite("Date", c(Date, Year), sep = " ") %>% mutate( Date = Date %>% lubridate::parse_date_time("m y") %>% yearmonth() ) %>% drop_na() %>% as_tsibble(index = "Date") %>% filter(Date <= "2018-12-01")# convert to ts formattax_ts 得到转换之后的数据,需要做进一步处理,检查数据中的显性和隐性的缺失:
# implicit missingshas_gaps(tax_tbl)# explicit missingscolSums(is.na(tax_tbl[, "Value"]))得到的结果大概是这样子
> # implicit missings> has_gaps(tax_tbl)# A tibble: 1 x 1 .gaps 1 FALSE> # explicit missings> colSums(is.na(tax_tbl[, "Value"]))Value 0上述结果说明,数据中没有显性和隐形的缺失。
现在来看一下我们的数据是什么样子的:
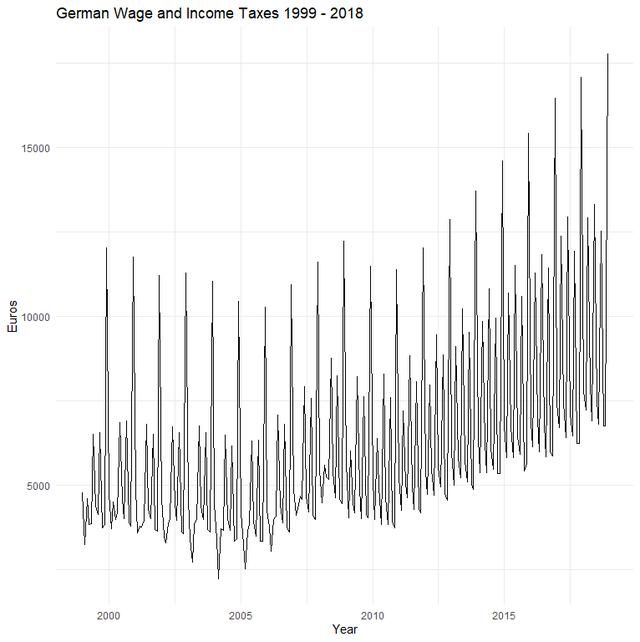
# visualizeplot_org % ggplot(aes(Date, Value / 1000)) + # to get the axis on a more manageable scale geom_line() + theme_minimal() + labs(title = "German Wage and Income Taxes 1999 - 2018", x = "Year", y = "Euros")plot_org接下来就是重要的部分了,差分!
如果你之前做过经典的时间序列模型,你可能对差分的概念有所疑惑。因为经典的时间序列模型需要数据具有稳定性。
稳定性意味着时间序列的均值和方差是有限的,而且不随时间的变化而变化。这就意味着时间序列的静态特性。然而就像我们在上面这个图中看到的,我们的时间序列并不具有稳定性,而是随着时间的递增,呈现出一种上升的趋势。
那么,差分和稳定性是怎么关联起来的呢,你可能知道,或者猜到,差分会使非稳定时间序列变为稳定的时间序列。很好,但是我们这边更关心的是差分能够改变序列的水平以及趋势(原文:differencing removes changes in the level of a series and, with it, the trend.)。这就是我们在随机森林中需要的!
那么怎么做呢?先来做一下差分,一阶差分
,还可以做这样的差分:
,比如说今年11月份数据和去年11月份数据做差分这样子。
我们知道差分会使时间序列的均值趋于稳定,Box-Cox或者log transformation会使方差趋于稳定。下面使Box-Cox变换的式子:
当lambda = 0 时,Box-Cox和log转换一样。我们使用上述式子对我们直接得到的值进行逆转换。赶紧行动起来吧,你可以通过实验去探究一个最好的lambda参数。(可使用forescast包)
这边只用log转换:
首先预估数据的差分阶数。
然后对数据进行log变换,然后再对其进行差分处理。
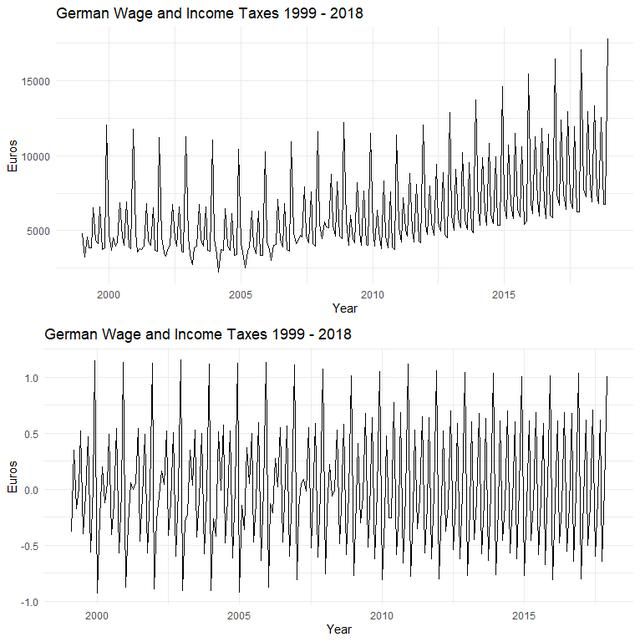
# pretend we're in December 2017 and have to forecast the next twelve monthstax_ts_org % log() %>% diff(n_diffs)# check out the difference! (pun)plot_trf % autoplot() + xlab("Year") + ylab("Euros") + ggtitle("German Wage and Income Taxes 1999 - 2018") + theme_minimal()gridExtra::grid.arrange(plot_org, plot_trf)可以得到下图,上面是原始的数据,下图是log变换+差分之后的数据。
我们来总结以下上面我们对数据做了什么,当然是log变换+差分处理,看似简单的两个操作却让我们的数据从非稳定变为稳定。
接下来要怎么做呢,接下来我们要使用这个处理完的数据来训练我们的随机森林然后使用它进行预测。当我们得到预测值之后,我们就可以通过反变换得到原始数据了。
在这之前我们还需要做的一个步骤是,modeling部分。我们要怎样reshape数据,使得一个机器学习算法可以处理?
为了将转换之后的数据放到随机森林中。我们需要将向量数据转换为矩阵数据。(vector -> matrix)。在此,我们用一个概念,time delay embedding。
Time delay embedding 表示在欧几里得空间中嵌入维度为K的时间序列,在R语言中,使用embed()函数就可以了。R语言代码如下:
lag_order 在RStudio中,tax_ts_mbd object是一个矩阵。
Time delay embedding让我们可以在时间序列上使用任何线性、非线性回归模型,比如说随机森林,gradient boosting,支持向量机等等。这边选择6个月的滞后性,当然这个不是固定的。与此同时,我们这边预测的范围是12个月。我们这边要预测2018年的tax revenue。
在这个博客中,采用直接预测的策略。(还有一种递归策略)
数据分割:
y_train 训练
forecasts_rf 将得到的预测数据通过转换回来
# calculate the exp termexp_term % mutate(Forecast = c(rep(NA, length(tax_ts_org)), y_pred))# visualize the forecastsplot_fc % ggplot(aes(x = Date)) + geom_line(aes(y = Value / 1000)) + geom_line(aes(y = Forecast / 1000), color = "blue") + theme_minimal() + labs( title = "Forecast of the German Wage and Income Tax for the Year 2018", x = "Year", y = "Euros" )accuracy(y_pred, y_test)得到下图:
可见,这个预测结果相当好的,MAPE达到了2.6%,不过只有这个标准还是不够的,还要计算一下简单的benchmark,季节性的模型。
可见这边的error指标很好,我们可以很安全地说,我们的随机森林表现得非常好。
思考
- 其实在上述模型中,或许还可以通过调整模型超参数来提高预测的效果。
- 或许随机森林莫i选哪个表现得相当好了,但是可能不是最好的,可以尝试其他的模型。


