20天吃掉那只pytorch——学习解读1
20天吃掉那只pytorch——学习解读1
前言:接触pytorch也三年多了,又很长一段时间没有系统的写过代码导致手有点生疏,这个系列我将依据20天吃掉那只pytorch这个优秀的项目回顾一遍pytorch的基本知识,并且加入自己几年学习的一些简单感悟写成文章分享记录,望大家多多指教有啥理解不对的希望提出!
项目地址:https://github.com/lyhue1991/eat_pytorch_in_20_days
一, Pytorch or TensorFlow2 对比
先说结论:
如果是工程师,应该优先选TensorFlow2.
如果是学生或者研究人员,应该优先选择Pytorch. (很多优秀的研究使用pytorch进行实现,当然TensorFlow也不少,其实建议两个都得看得懂起码)
如果时间足够,最好TensorFlow2和Pytorch都要学习掌握。
理由如下:
- 1,在工业界最重要的是模型落地,目前国内的大部分互联网企业只支持TensorFlow模型的在线部署,不支持Pytorch。 并且工业界更加注重的是模型的高可用性,许多时候使用的都是成熟的模型架构,调试需求并不大。(以我一年半的实习工作经验来说的确这样的,但是pytorch其实也会用。不过对比起来还是TensorFlow的生态更加完整,因为大型企业还要涉及web端和Android端的考虑,这些方面TensorFlow展示出了强大的优势)
- 2,研究人员最重要的是快速迭代发表文章,需要尝试一些较新的模型架构。而Pytorch在易用性上相比TensorFlow2有一些优势,更加方便调试。 并且在2019年以来在学术界占领了大半壁江山,能够找到的相应最新研究成果更多。(以我摸鱼的科研经验来说,是的,目前pytorch更大2021)
- 3,TensorFlow2和Pytorch实际上整体风格已经非常相似了,学会了其中一个,学习另外一个将比较容易。两种框架都掌握的话,能够参考的开源模型案例更多,并且可以方便地在两种框架之间切换。
对应的的TensorFlow镜像教程:
《30天吃掉那只TensorFlow2》:https://github.com/lyhue1991/eat_tensorflow2_in_30_days
二、结构化数据建模与处理流程实例——预测轮船撞击冰山沉没后乘客生存可能性
摘要:
从Excel表格中获取数据,利用Pandas中的DataFrame进行预处理为想要的数据结构或格式;
2.1 准备数据
#titanic数据集的目标是根据乘客信息预测他们在Titanic号撞击冰山沉没后能否生存。

#结构化数据一般会使用Pandas中的DataFrame进行预处理。

import numpy as np
import pandas as pd
import matplotlib.pyplot as plt
import torch
from torch import nn
from torch.utils.data import Dataset,DataLoader,TensorDataset

dftrain_raw = pd.read_csv('./data/titanic/train.csv')
dftest_raw = pd.read_csv('./data/titanic/test.csv')
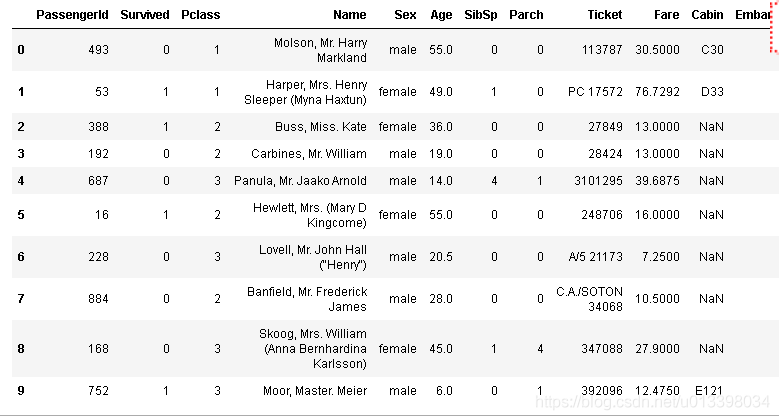
dftrain_raw.head(10)
字段说明:
* Survived:0代表死亡,1代表存活【y标签】
* Pclass:乘客所持票类,有三种值(1,2,3) 【转换成onehot编码】
* Name:乘客姓名 【舍去】
* Sex:乘客性别 【转换成bool特征】
* Age:乘客年龄(有缺失) 【数值特征,添加“年龄是否缺失”作为辅助特征】
* SibSp:乘客兄弟姐妹/配偶的个数(整数值) 【数值特征】
* Parch:乘客父母/孩子的个数(整数值)【数值特征】
* Ticket:票号(字符串)【舍去】
* Fare:乘客所持票的价格(浮点数,0-500不等) 【数值特征】
* Cabin:乘客所在船舱(有缺失) 【添加“所在船舱是否缺失”作为辅助特征】
* Embarked:乘客登船港口:S、C、Q(有缺失)【转换成onehot编码,四维度 S,C,Q,nan】
利用Pandas的数据可视化功能我们可以简单地进行探索性数据分析EDA(Exploratory Data Analysis)。
label分布情况 画图进阶了解
#用在Jupyter notebook中具体作用是当你调用matplotlib.pyplot的绘图函数plot()进行绘图的时候,或者生成一个figure画布的时候,可以直接在你的python console里面生成图像。
%matplotlib inline
#Jupyter notebook 中的魔法命令 ,可以设定显示图片的分辨率 retina svg png 常用三种
%config InlineBackend.figure_format = 'png'
#统计survived 中不同值的总数,并画图,画图默认是按照行来读取。因此画出0,1的数量统计条形图。
ax = dftrain_raw['Survived'].value_counts().plot(kind = 'bar',
     figsize = (12,8),fontsize=15,rot = 0)
ax.set_ylabel('Counts',fontsize = 15)
ax.set_xlabel('Survived',fontsize = 15)
plt.show()#年龄分布情况 画的是频数分布直方图
#Hist只需要一列的数据,绘图的x轴将表示这一列数据的种类,y轴表示该类别出现的次数;
%matplotlib inline
%config InlineBackend.figure_format = 'png'
ax = dftrain_raw['Age'].plot(kind = 'hist',bins = 20,color= 'purple',
figsize = (12,8),fontsize=15)
ax.set_ylabel('Frequency',fontsize = 15)
ax.set_xlabel('Age',fontsize = 15)
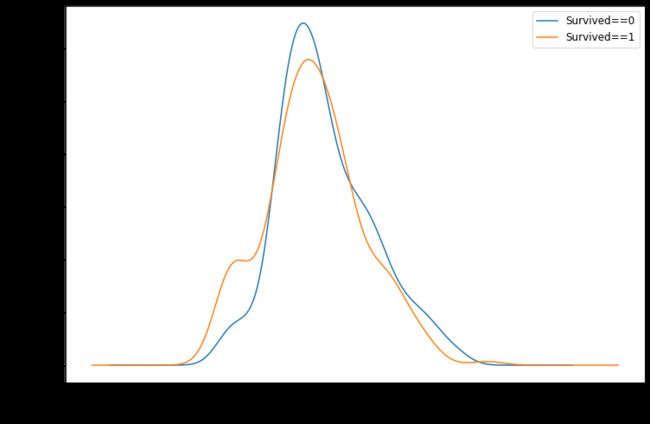
plt.show()密度图,分析年龄与死亡label的关系,画图介绍
#年龄和label的相关性

%matplotlib inline
%config InlineBackend.figure_format = 'png'
ax = dftrain_raw.query('Survived == 0')['Age'].plot(kind = 'density',
                      figsize = (12,8),fontsize=15)
dftrain_raw.query('Survived == 1')['Age'].plot(kind = 'density',
                      figsize = (12,8),fontsize=15)
ax.legend(['Survived==0','Survived==1'],fontsize = 12)
ax.set_ylabel('Density',fontsize = 15)
ax.set_xlabel('Age',fontsize = 15)
plt.show()
图中我们看到,各年龄关在死亡label上的核密度关系。基本差不多。
简单分析后进行正式的数据预处理,为模型训练做准备
def preprocessing(dfdata):

    dfresult= pd.DataFrame()

    #Pclass
    dfPclass = pd.get_dummies(dfdata['Pclass'])
    dfPclass.columns = ['Pclass_' +str(x) for x in dfPclass.columns ]
    dfresult = pd.concat([dfresult,dfPclass],axis = 1)

    #Sex
    dfSex = pd.get_dummies(dfdata['Sex'])
    #拼接列
    dfresult = pd.concat([dfresult,dfSex],axis = 1)

    #Age 有缺失的数据,增加了一行代表是否缺失
    dfresult['Age'] = dfdata['Age'].fillna(0)
    dfresult['Age_null'] = pd.isna(dfdata['Age']).astype('int32')

    #SibSp,Parch,Fare
    dfresult['SibSp'] = dfdata['SibSp']
    dfresult['Parch'] = dfdata['Parch']
    dfresult['Fare'] = dfdata['Fare']

    #Carbin 有无缺失作为0/1
    dfresult['Cabin_null'] =  pd.isna(dfdata['Cabin']).astype('int32')

    #Embarked one-hot 四维度有个nan
    dfEmbarked = pd.get_dummies(dfdata['Embarked'],dummy_na=True)
    dfEmbarked.columns = ['Embarked_' + str(x) for x in dfEmbarked.columns]
    dfresult = pd.concat([dfresult,dfEmbarked],axis = 1)

    return(dfresult)
#对样本进行处理。把各类型数据转化为数值,为了进行下一步计算。
x_train = preprocessing(dftrain_raw).values
print(x_train[1])
#label直接使用Survived中的0,1值
y_train = dftrain_raw[['Survived']].values

x_test = preprocessing(dftest_raw).values
y_test = dftest_raw[['Survived']].values

# 查看数据形状
print("x_train.shape =", x_train.shape )
print("x_test.shape =", x_test.shape )

print("y_train.shape =", y_train.shape )
print("y_test.shape =", y_test.shape )

#进一步使用DataLoader和TensorDataset封装成可以迭代的数据管道。

dl_train = DataLoader(TensorDataset(torch.tensor(x_train).float(),torch.tensor(y_train).float()),
                     shuffle = True, batch_size = 8)
dl_valid = DataLoader(TensorDataset(torch.tensor(x_test).float(),torch.tensor(y_test).float()),
                     shuffle = False, batch_size = 8)
# 测试数据管道
for features,labels in dl_train:
    print(features,labels)
break- 二,定义模型
使用Pytorch通常有三种方式构建模型:使用nn.Sequential按层顺序构建模型,继承nn.Module基类构建自定义模型,继承nn.Module基类构建模型并辅助应用模型容器进行封装。
此处选择使用最简单的nn.Sequential,按层顺序模型。
#nn.Sequential
def create_net():
    net = nn.Sequential()
    net.add_module("linear1",nn.Linear(15,20))
    net.add_module("relu1",nn.ReLU())
    net.add_module("linear2",nn.Linear(20,15))
    net.add_module("relu2",nn.ReLU())
    net.add_module("linear3",nn.Linear(15,1))
    net.add_module("sigmoid",nn.Sigmoid())
    return net

net = create_net()
print(net)

!pip install torchkeras
!pip install prettytable
!pip install datetime

from torchkeras import summary
summary(net,input_shape=(15,))
- 三,训练模型
Pytorch通常需要用户编写自定义训练循环,训练循环的代码风格因人而异。
有3类典型的训练循环代码风格:脚本形式训练循环,函数形式训练循环,类形式训练循环。
此处介绍一种较通用的脚本形式。
!pip install sklearn
from sklearn.metrics import accuracy_score

loss_func = nn.BCELoss()
optimizer = torch.optim.Adam(params=net.parameters(),lr = 0.01)
#匿名函数 ,代表输入y_pred,y_true 得到准确率打分
metric_func = lambda y_pred,y_true: accuracy_score(y_true.data.numpy(),y_pred.data.numpy()>0.5)
metric_name = "accuracy"

epochs = 10
log_step_freq = 30

dfhistory = pd.DataFrame(columns = ["epoch","loss",metric_name,"val_loss","val_"+metric_name])

print("Start Training...")
nowtime = datetime.datetime.now().strftime('%Y-%m-%d %H:%M:%S')
print("=========="*8 + "%s"%nowtime)

for epoch in range(1,epochs+1):

    # 1,训练循环-------------------------------------------------
    net.train()
    loss_sum = 0.0
    metric_sum = 0.0
    step = 1

    for step, (features,labels) in enumerate(dl_train, 1):

        # 梯度清零
        optimizer.zero_grad()

        # 正向传播求损失
        predictions = net(features)
        loss = loss_func(predictions,labels)
        metric = metric_func(predictions,labels)

        # 反向传播求梯度
        loss.backward()
        optimizer.step()

        # 打印batch级别日志
        loss_sum += loss.item()
        metric_sum += metric.item()
        if step%log_step_freq == 0:
            print(("[step = %d] loss: %.3f, "+metric_name+": %.3f") %
                  (step, loss_sum/step, metric_sum/step))

    # 2,验证循环-------------------------------------------------
    net.eval()
    val_loss_sum = 0.0
    val_metric_sum = 0.0
    val_step = 1

    for val_step, (features,labels) in enumerate(dl_valid, 1):
        # 关闭梯度计算
        with torch.no_grad():
            predictions = net(features)
            val_loss = loss_func(predictions,labels)
            val_metric = metric_func(predictions,labels)
        val_loss_sum += val_loss.item()
        val_metric_sum += val_metric.item()

    # 3,记录日志-------------------------------------------------
    info = (epoch, loss_sum/step, metric_sum/step,
            val_loss_sum/val_step, val_metric_sum/val_step)
    dfhistory.loc[epoch-1] = info

    # 打印epoch级别日志
    print(("\nEPOCH = %d, loss = %.3f,"+ metric_name + \
          "  = %.3f, val_loss = %.3f, "+"val_"+ metric_name+" = %.3f")
          %info)
    nowtime = datetime.datetime.now().strftime('%Y-%m-%d %H:%M:%S')
    print("\n"+"=========="*8 + "%s"%nowtime)

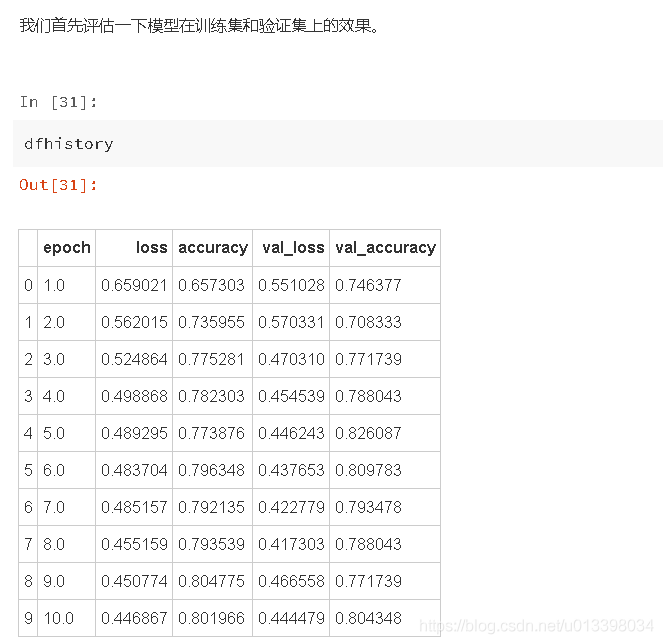
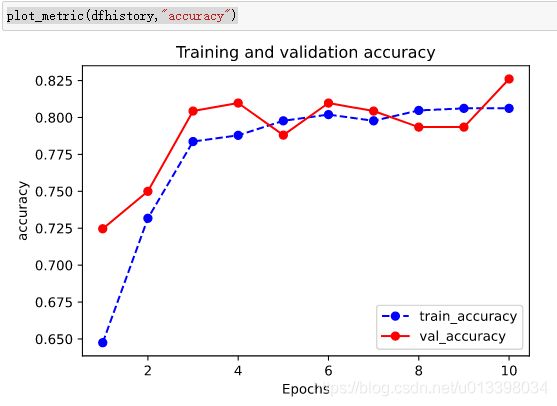
print('Finished Training...')- 四,评估模型
%matplotlib inline
%config InlineBackend.figure_format = 'svg'

import matplotlib.pyplot as plt

def plot_metric(dfhistory, metric):
    train_metrics = dfhistory[metric]
    val_metrics = dfhistory['val_'+metric]
    epochs = range(1, len(train_metrics) + 1)
    plt.plot(epochs, train_metrics, 'bo--')
    plt.plot(epochs, val_metrics, 'ro-')
    plt.title('Training and validation '+ metric)
    plt.xlabel("Epochs")
    plt.ylabel(metric)
    plt.legend(["train_"+metric, 'val_'+metric])
    plt.show()
plot_metric(dfhistory,"loss")
分析下两个指标
- 五,使用模型
#预测概率 .data
y_pred_probs = net(torch.tensor(x_test[0:10]).float()).data

#预测类别
y_pred = torch.where(y_pred_probs>0.5,
        torch.ones_like(y_pred_probs),torch.zeros_like(y_pred_probs))
- 六,保存模型
Pytorch 有两种保存模型的方式,都是通过调用pickle序列化方法实现的。
第一种方法只保存模型参数。
第二种方法保存完整模型。
推荐使用第一种,第二种方法可能在切换设备和目录的时候出现各种问题。其实第二种也需要加载模型结构文件,暂时不知道为啥,我用的时候一直是这样。
# 保存模型参数

torch.save(net.state_dict(), "./data/net_parameter.pkl")

net_clone = create_net()
net_clone.load_state_dict(torch.load("./data/net_parameter.pkl"))

net_clone.forward(torch.tensor(x_test[0:10]).float()).data
#保存完整模型
torch.save(net, './data/net_model.pkl')
net_loaded = torch.load('./data/net_model.pkl')
net_loaded(torch.tensor(x_test[0:10]).float()).data


