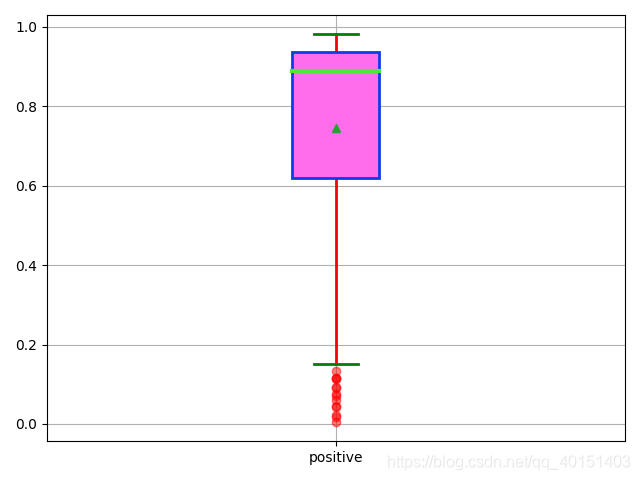
箱线图画法详解:颜色、标签、大小等
一、定义
箱线图,又称箱型图或盒式图。包含了统计学中的分位数、均值、极值等统计量,不仅能够分析不同类别数据的平均水平差异,还能揭示数据离散程度、异常值、分布差异等。
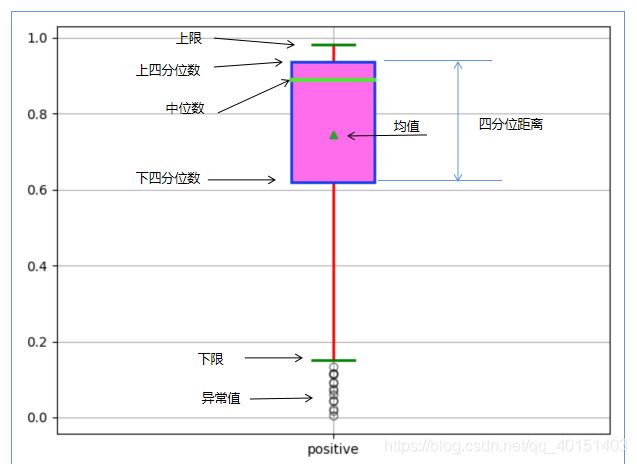
四分位数(Quartile),即统计学中,把所有数值由小到大排列并分成四等份,处于三个分割点位置的得分就是四分位数。
第一四分位数(Q1),又称“较小四分位数”,等于该样本中所有数值由小到大排列后第25%的数字。Q1的位置=(n+1)/4
第二四分位数 (Q2),又称“中位数”,等于该样本中所有数值由小到大排列后第50%的数字。Q2的位置=(n+1)/2
第三四分位数 (Q3),又称“较大四分位数”,等于该样本中所有数值由小到大排列后第75%的数字。Q3的位置=3(n+1)/4
n表示项数
第三四分位数与第一四分位数的差距又称四分位距(InterQuartile Range,IQR)。
二、输入
输入是列表形式的数据,以下是我的输入,也可以自己定义或用random随机生成。
import csv
import pandas as pd
import matplotlib.pyplot as plt

file_in = open('D:/emotion_analysis_data/cleaned/vs_box.csv', 'r', encoding='utf-8')
positive = csv.DictReader(file_in, ['id', 'confidence', 'text'])
next(positive)
all_positive = []
for i, record in enumerate(positive):
    con_str = record['confidence']
    con_list = con_str.split(' ')
    del(con_list[0])
    constr = ''.join(con_list)
    value_str = constr.replace(']', '')
    value = float(value_str)
    all_positive.append(value)
把输入的列表数据all_positive写入data,即
data = {'positive': all_positive}
df = pd.DataFrame(data)
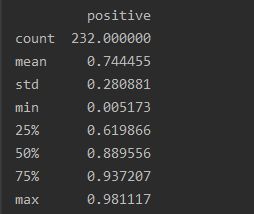
print(df.describe())
输出关于该数据的统计量描述,即箱线图所需数据:
三、画箱线图
将以上数据用箱线图表示:
f = df.boxplot(sym='r.', patch_artist=True, return_type='dict', meanline=False, showmeans=True)

for box in f['boxes']:
    box.set(color='#0E3CE6', linewidth=2) # 箱体边框
    box.set(facecolor='#FF6CEC')  # 箱体内部填充颜色
for whisker in f['whiskers']:
    whisker.set(color='r', linewidth=2)
for cap in f['caps']:
    cap.set(color='g', linewidth=2)
for median in f['medians']:
    median.set(color='#52E636', linewidth=3)
for mean in f['means']:
    mean.set(color='#52E636')
for flier in f['fliers']:
    flier.set(marker='o', color='y', alpha=0.5)

plt.show()
f = df.boxplot(sym='r.', patch_artist=True, return_type='dict', meanline=False, showmeans=True)
plt.show()
输出:
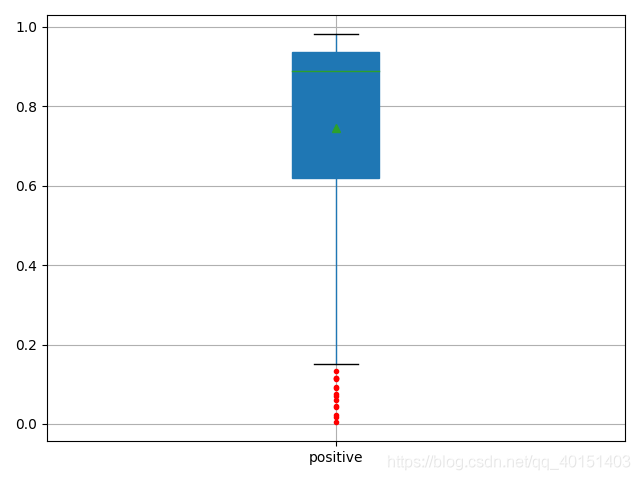
至此箱线图就画好了。
四、参数详解
sym:表示异常点形状与颜色;
vert:表示箱体横向还是竖向,默认竖向True;
patch_artist:表示上下四分位框内是否填充,True为填充;
meanline=False, showmeans=True:是否用线条展示均值,是否展示均值;
whiskers:指定上下须与上下四分位的距离,默认为1.5倍的四分位差;
caps:设置箱线图顶端和末端线条的属性,如颜色、粗细等;
medians:中位数:排序后处于中间的数据
means:均值
fliers:异常值属性
boxes:箱体参数
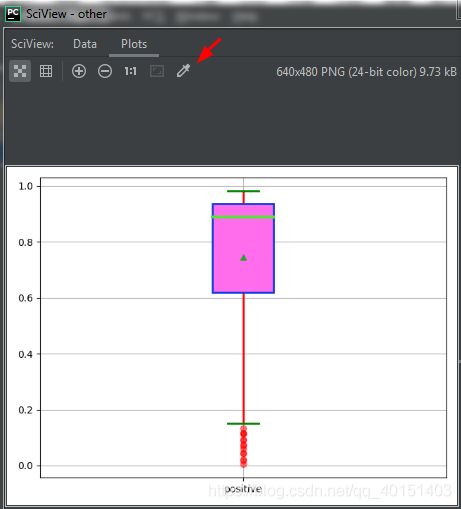
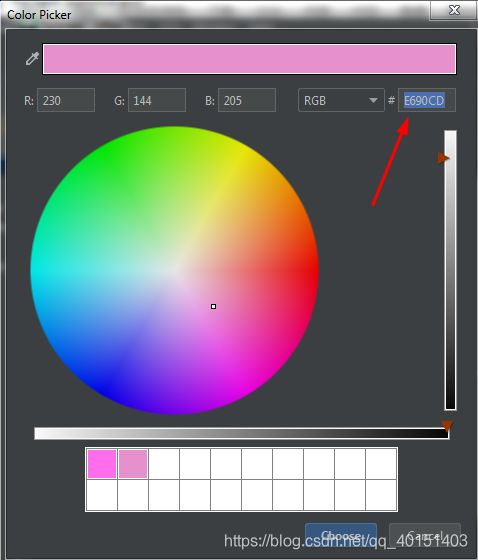
color参数设置点开图形中的Plots的画笔进行自定义:
五、数据分布
- 箱子的宽度在一定程度上反映了数据的波动程度。箱体越扁说明数据越集中,端线(也就是“须”)越短也说明数据集中。
- 异常值集中在较小值一侧,则分布呈现左偏态;异常值集中在较大值一侧,则分布呈现右偏态。
- 长长的细尾巴在左边即为左偏,长长的细尾巴在右边边即为右偏
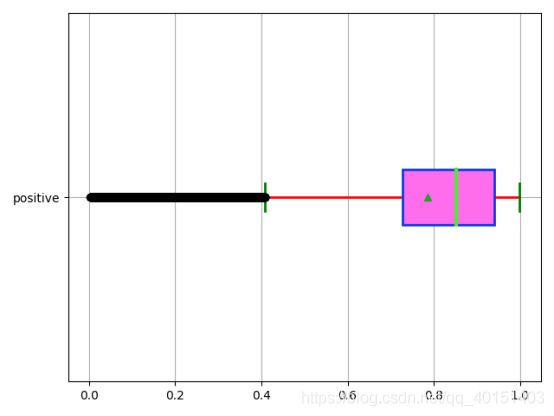
例如上图,数据呈左偏态,那么靠近最大值的数据比较多,中位数也靠近最大值及上四分位数。反之,数据呈右偏态,那么这组数据靠近最小值的数据比较多,中位线也靠近最小值。
