纵向驾驶员行为建模(can总线数据)一:数据处理pandas
参考
基于深度学习的驾驶行为预测方法
数据来源
使用can总线采集数据

不需要这么多数据,仅需要’FrameID’,‘Velocity’,‘AcceleratorPedalPos’,‘BrakePedalSignal’,‘EngineSpeed’
数据处理
1. 读取数据
import pandas as pd
import numpy as np
import matplotlib.pyplot as plt

df = pd.read_csv('D:/driver/LongitudeDriver/DATA/autocan.csv')
#打印列名
print(df.columns.values)
筛选数据
仅需要’FrameID’,‘Velocity’,‘AcceleratorPedalPos’,‘BrakePedalSignal’,‘EngineSpeed’
#筛选'FrameID','Velocity','AcceleratorPedalPos','BrakePedalSignal''EngineSpeed'
df=df[['FrameID','Velocity','AcceleratorPedalPos','BrakePedalSignal','EngineSpeed']]
2.异常值处理
缺失值
此数据集缺失值为na,系统自己无法识别。所以须转换系统可识别的空值,然后进行数值替换
df.replace('na',np.NaN,inplace=True) #将表内na值替换为空
print(df.isna().sum())#输出缺失值个数
df["AcceleratorPedalPos"].fillna(method ='ffill', inplace = True)#用缺失值前一个值代替缺失值
异常值
首先需要把不可计算的数据类型,转换为可计算的
1、查看数据类型
代码
#查看各列数据类型
print(df.dtypes)
输出结果

2、数据类型转换
将object型转换为float型
代码
df['AcceleratorPedalPos'] = pd.to_numeric(df['AcceleratorPedalPos'], downcast="float")#转换为float型
3、异常值检测
使用拉伊达准则检测异常值
# ser1表示传入DataFrame的某一列
def three_sigma(ser1):
    # 求平均值
    mean_value = ser1.mean()
    # 求标准差
    std_value = ser1.std()
    # 位于(μ-3σ,μ+3σ)区间内的数据是正常的,不在该区间的数据是异常的
    # ser1中的数值小于μ-3σ或大于μ+3σ均为异常值
    # 一旦发现异常值就标注为True,否则标注为False
    rule = (mean_value - 3 * std_value > ser1) | (mean_value + 3 * std_value < ser1)
    # 返回异常值的位置索引
    index = np.arange(ser1.shape[0])[rule]
    # 获取异常数据
    outrange = ser1.iloc[index]
    return(outrange)

print('EngineSpeed异常值',three_sigma(df['EngineSpeed']))
print('Velocity异常值',three_sigma(df['Velocity']))
print('AcceleratorPedalPos异常值',three_sigma(df['AcceleratorPedalPos']))
#看着筛选出的异常值在实际情况下很正常,所以不做处理
3.数据归一化
注意:'FrameID’为帧数,不能归一化
代码
#归一化
df1=df[['Velocity','AcceleratorPedalPos','EngineSpeed','BrakePedalSignal']]
df=df[['FrameID']]
df1_norm=(df1-df1.min())/(df1.max()-df1.min())
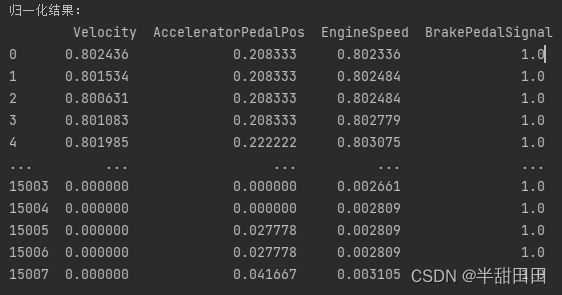
print('\n归一化结果:\n',df1_norm)
4.数据可视化
代码:
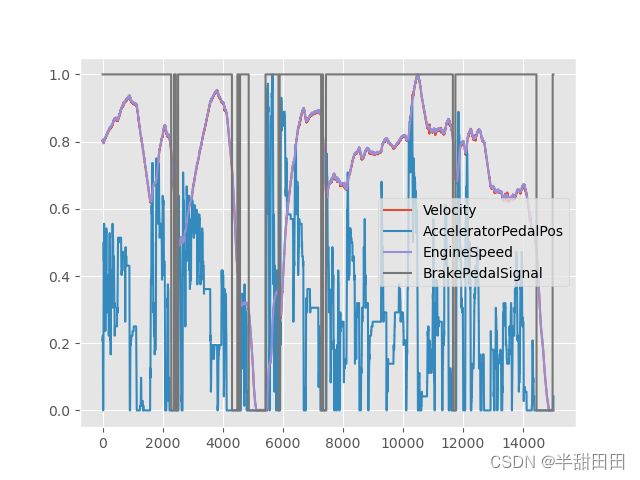
#数据曲线图
df1_norm.plot() #四个数据曲线图
plt.show() #显示图像
5.处理后数据保存为.csv文件
#将指定列内容另存到’follow_metadata.csv‘文件中,并且去除行索引
df.to_csv('D:/driver/LongitudeDriver/DATA/dataCan.csv',index=False)
完整代码
import pandas as pd
import matplotlib.pyplot as plt
import numpy as np

#读取数据
df = pd.read_csv('D:/driver/LongitudeDriver/DATA/autocan.csv')
#打印列名
print(df.columns.values)

#===================筛选数据====================================
#筛选'FrameID','Velocity','AcceleratorPedalPos','BrakePedalSignal''EngineSpeed'
df=df[['FrameID','Velocity','AcceleratorPedalPos','BrakePedalSignal','EngineSpeed']]
#查看各列数据类型
print(df.dtypes)


#================处理异常值=====================================
#1.缺失值处理
#数据中为na的为空值
df.replace('na',np.NaN,inplace=True) #将表内na值替换为空
print(df.isna().sum())#输出缺失值个数
df["AcceleratorPedalPos"].fillna(method ='ffill', inplace = True)#用缺失值前一个值代替缺失值
print(df.isna().sum())#输出缺失值个数

#查看各列数据类型
print(df.dtypes)
df['AcceleratorPedalPos'] = pd.to_numeric(df['AcceleratorPedalPos'], downcast="float")#转换为float型

plt.style.use('ggplot')
df.Velocity.plot(kind='hist',bins = 30,density = True)
df.Velocity.plot(kind='kde')
plt.show()

#拉伊达准则检测异常值
# ser1表示传入DataFrame的某一列
def three_sigma(ser1):
    # 求平均值
    mean_value = ser1.mean()
    # 求标准差
    std_value = ser1.std()
    # 位于(μ-3σ,μ+3σ)区间内的数据是正常的,不在该区间的数据是异常的
    # ser1中的数值小于μ-3σ或大于μ+3σ均为异常值
    # 一旦发现异常值就标注为True,否则标注为False
    rule = (mean_value - 3 * std_value > ser1) | (mean_value + 3 * std_value < ser1)
    # 返回异常值的位置索引
    index = np.arange(ser1.shape[0])[rule]
    # 获取异常数据
    outrange = ser1.iloc[index]
    return(outrange)

print('EngineSpeed异常值',three_sigma(df['EngineSpeed']))
print('Velocity异常值',three_sigma(df['Velocity']))
print('AcceleratorPedalPos异常值',three_sigma(df['AcceleratorPedalPos']))
#看着筛选出的异常值在实际情况下很正常,所以不做处理

#箱型图绘制
# plt.boxplot(df['EngineSpeed'])
# df.boxplot(column=['Velocity','AcceleratorPedalPos','EngineSpeed'])
# plt.show()

#归一化
df1=df[['Velocity','AcceleratorPedalPos','EngineSpeed','BrakePedalSignal']]
df=df[['FrameID']]
df1_norm=(df1-df1.min())/(df1.max()-df1.min())
print('\n归一化结果:\n',df1_norm)

#数据曲线图
df1_norm.plot() #四个数据曲线图
plt.show() #显示图像

#合并数据
df = pd.concat([df,df1_norm],axis=1)#合并
print(df)

# 将指定列内容另存到’follow_metadata.csv‘文件中,并且去除行索引
df.to_csv('D:/driver/LongitudeDriver/DATA/dataCan.csv',index=False)


