用python来实现机器学习(一):线性回归(linear regression)
需要下载一个data:auto-mpg.data
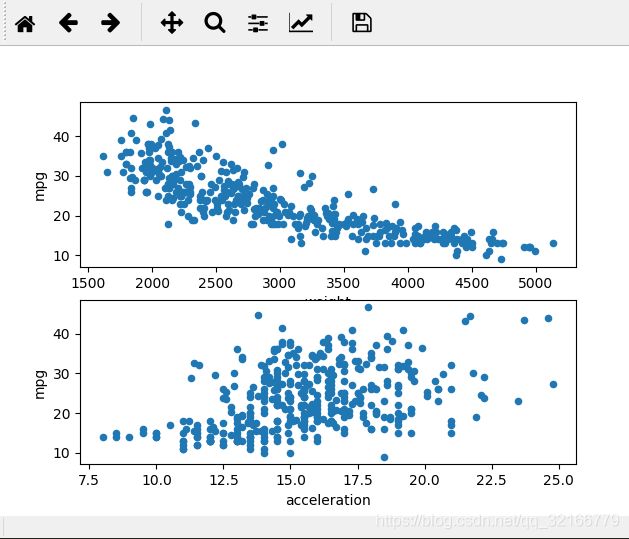
第一步:显示数据集图
import pandas as pd
import matplotlib.pyplot as plt
columns = ["mpg","cylinders","displacement","horsepower","weight","acceleration","model year","origin","car name"]
cars = pd.read_table("E:/3_python_code/python_ml/data/auto-mpg.data",delim_whitespace=True,names=columns)
print (cars.head(5))
#加了两个子图
fig = plt.figure()
ax1 = fig.add_subplot(2,1,1)
ax2 = fig.add_subplot(2,1,2)
cars.plot("weight","mpg",kind="scatter",ax=ax1)
cars.plot("acceleration","mpg",kind="scatter",ax=ax2)
plt.show()
第二步:训练并预测
import pandas as pd
import matplotlib.pyplot as plt
columns = ["mpg","cylinders","displacement","horsepower","weight","acceleration","model year","origin","car name"]
cars = pd.read_table("E:/3_python_code/python_ml/data/auto-mpg.data",delim_whitespace=True,names=columns)
# print (cars.head(5))
# #加了两个子图
fig = plt.figure()
# ax1 = fig.add_subplot(2,1,1)
# ax2 = fig.add_subplot(2,1,2)
# cars.plot("weight","mpg",kind="scatter",ax=ax1)
# cars.plot("acceleration","mpg",kind="scatter",ax=ax2)
# plt.show()
import sklearn
from sklearn.linear_model import LinearRegression
lr = LinearRegression()
#训练
lr.fit(cars[["weight"]],cars["mpg"])
#预测
predictions = lr.predict(cars[["weight"]])
from sklearn.metrics import mean_squared_error
#均方误差
mse = mean_squared_error(cars["mpg"],predictions)
print(mse)
print(predictions[0:5])
print(cars["mpg"][0:5])
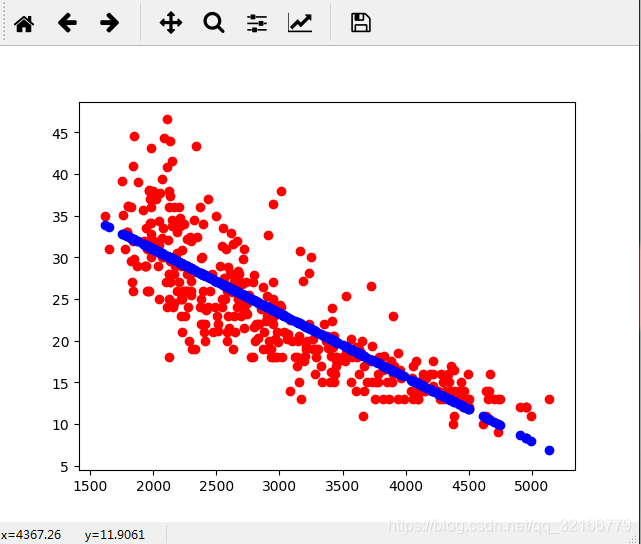
plt.scatter(cars["weight"],cars["mpg"],c="red")
plt.scatter(cars["weight"],predictions,c="blue")
plt.show()
输出结果 显示均方误差18.78,如下
18.7809397346
[ 19.41852276 17.96764345 19.94053224 19.96356207 19.84073631]
0 18.0
1 15.0
2 18.0
3 16.0
4 17.0
Name: mpg, dtype: float64
Process finished with exit code 0