《scikit-learn机器学习》波斯顿房价预测(线性回归预测)
本节内容:
首先是要导入数据,看数据有多少个样本,有多少个特征标签,对其进行模型训练,用线性回归的方式对80%的训练集进行训练,发现训练的score比较低,优化为多项式模型,画学习曲线判断哪个多项式最符合,然后就训练出房价。
导入模块
%matplotlib inline
import matplotlib.pyplot as plt
import numpy as np
导入数据并且看有多少样本
from sklearn.datasets import load_boston

boston = load_boston()
X = boston.data
y = boston.target
X.shape
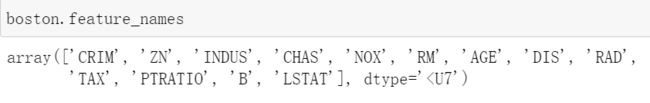
看有多少特征标签
boston.feature_names
分离数据集
from sklearn.model_selection import train_test_split
X_train, X_test, y_train, y_test = train_test_split(X, y, test_size=0.2, random_state=3)
用线性回归模型进行训练
python3.8的time中,clock被禁用了,改为:perf_counter()
import time
from sklearn.linear_model import LinearRegression

model = LinearRegression()

start = time.perf_counter()
model.fit(X_train, y_train)

train_score = model.score(X_train, y_train)
cv_score = model.score(X_test, y_test)
print('elaspe: {0:.6f}; train_score: {1:0.6f}; cv_score: {2:.6f}'.format(time.perf_counter()-start, train_score, cv_score))
![]()
发现预测的效果不太好,优化模型
二阶多项式模型:degree=2
from sklearn.linear_model import LinearRegression
from sklearn.preprocessing import PolynomialFeatures
from sklearn.pipeline import Pipeline

def polynomial_model(degree=1):
    polynomial_features = PolynomialFeatures(degree=degree,
                                             include_bias=False)
    linear_regression = LinearRegression(normalize=True)
    pipeline = Pipeline([("polynomial_features", polynomial_features),
                         ("linear_regression", linear_regression)])
    return pipeline

model = polynomial_model(degree=2)

start = time.perf_counter()
model.fit(X_train, y_train)

train_score = model.score(X_train, y_train)
cv_score = model.score(X_test, y_test)
print('elaspe: {0:.6f}; train_score: {1:0.6f}; cv_score: {2:.6f}'.format(time.perf_counter()-start, train_score, cv_score))
![]()
绘制学习曲线
degree = 1,2,3,也就是一阶,二阶,三阶
二阶的学习曲线交叉间距太大,说明需要更多的训练集
from common.utils import plot_learning_curve
from sklearn.model_selection import ShuffleSplit

cv = ShuffleSplit(n_splits=10, test_size=0.2, random_state=0)
plt.figure(figsize=(18, 4))
title = 'Learning Curves (degree={0})'
degrees = [1, 2, 3]

start = time.clock()
plt.figure(figsize=(18, 4), dpi=200)
for i in range(len(degrees)):
    plt.subplot(1, 3, i + 1)
    plot_learning_curve(plt, polynomial_model(degrees[i]), title.format(degrees[i]), X, y, ylim=(0.01, 1.01), cv=cv)

print('elaspe: {0:.6f}'.format(time.clock()-start))
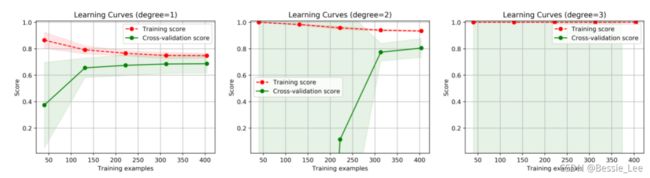
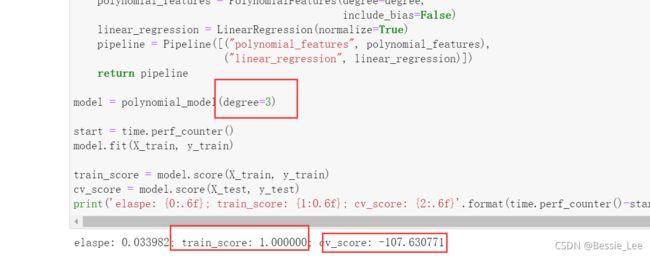
如果为三阶
其中score为负数,说明这个过拟合过分了,不适合
其实线性回归的模型都差不多,代码都是一个样子的,只用换degree就行。