SKlearn之手写数字识别(Recognizing hand-written digits)
题目链接:Recognizing hand-written digits
函数解释
zip函数:python zip函数
plt.imshow(image, cmap=plt.cm.gray_r, interpolation='nearest')
matplotlib.pyplot.imshow(X, cmap=None, norm=None, aspect=None, interpolation=None, alpha=None, vmin=None, vmax=None, origin=None, extent=None, shape=
cmap=plt.cm.gray_r指的是画灰度图,其中还有四种方法:Python中matplotlib.pyplot.imshow画灰度图的多种方法
interpolation代表的是插值运算,'nearest'只是选取了其中的一种插值方式。
reshape(m,n) n,m 其中正实数表示具体的行(列),-1 表示未指定值,(samples, feature)
fit(self, X, y, sample_weight=None) 根据给定的训练数据对模型进行拟合
enumerate():Python enumerate() 函数
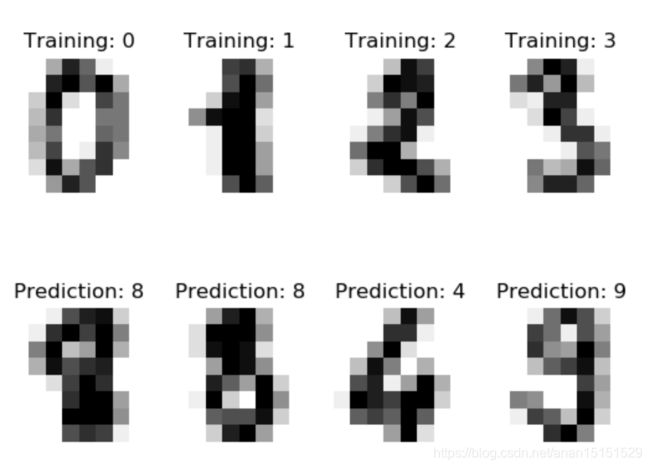
结果:
输出:
Classification report for classifier SVC(gamma=0.001):
              precision    recall  f1-score   support

           0       1.00      0.99      0.99        88
           1       0.99      0.97      0.98        91
           2       0.99      0.99      0.99        86
           3       0.98      0.87      0.92        91
           4       0.99      0.96      0.97        92
           5       0.95      0.97      0.96        91
           6       0.99      0.99      0.99        91
           7       0.96      0.99      0.97        89
           8       0.94      1.00      0.97        88
           9       0.93      0.98      0.95        92

    accuracy                           0.97       899
   macro avg       0.97      0.97      0.97       899
weighted avg       0.97      0.97      0.97       899


Confusion matrix:
[[87  0  0  0  1  0  0  0  0  0]
 [ 0 88  1  0  0  0  0  0  1  1]
 [ 0  0 85  1  0  0  0  0  0  0]
 [ 0  0  0 79  0  3  0  4  5  0]
 [ 0  0  0  0 88  0  0  0  0  4]
 [ 0  0  0  0  0 88  1  0  0  2]
 [ 0  1  0  0  0  0 90  0  0  0]
 [ 0  0  0  0  0  1  0 88  0  0]
 [ 0  0  0  0  0  0  0  0 88  0]
 [ 0  0  0  1  0  1  0  0  0 90]]
程序:
# encoding: utf-8
print(__doc__)

# 引用数据库
import matplotlib.pyplot as plt
from sklearn import datasets, svm, metrics

# 加载数据
digits = datasets.load_digits()
images_and_labels = list(zip(digits.images, digits.target))

# 显示训练数据
for index, (image, label) in enumerate(images_and_labels[:5]):
    plt.subplot(2, 4, index + 1)
    plt.axis('off')
    plt.imshow(image, cmap=plt.cm.gray_r, interpolation='nearest')
    plt.title('Training: %i' % label)

# 数据预处理
n_samples = len(digits.images)
data = digits.images.reshape((n_samples, -1))

# 学习训练,用前半部分
classifier = svm.SVC(gamma=0.001)
classifier.fit(data[:n_samples // 2], digits.target[:n_samples // 2])

# 预测数值,用后本部分数据
expected = digits.target[n_samples // 2:]
predicted = classifier.predict(data[n_samples // 2:])

# 分类器测试及混淆矩阵
print("Classification report for classifier %s:\n%s\n"
      % (classifier, metrics.classification_report(expected, predicted)))
print("Confusion matrix:\n%s" % metrics.confusion_matrix(expected, predicted))

# 显示预测数值
images_and_predictions = list(zip(digits.images[n_samples // 2:], predicted))
for index, (image, prediction) in enumerate(images_and_predictions[:4]):
    plt.subplot(2, 4, index + 5)
    plt.axis('off')
    plt.imshow(image, cmap=plt.cm.gray_r, interpolation='nearest')
    plt.title('Prediction: %i' % prediction)

plt.show()
