R语言卡方检验最全总结
本文首发于公众号:医学和生信笔记,完美观看体验请至公众号查看本文。
医学和生信笔记,专注R语言在临床医学中的使用,R语言数据分析和可视化。
卡方检验/列联表资料的卡方检验在临床中非常常见!
因为最近又有一批临床数据要进行统计,所以趁机把卡方检验的R语言实现再重新梳理一遍。
这篇文章涵盖了孙振球,徐勇勇《医学统计学》第4版 卡方检验章节 中的 所有内容。课本电子版和配套数据已上传到QQ群,需要的朋友加群下载即可。
文章目录
-
- 不同类型卡方检验的选择
- 四格表资料的卡方检验
-
- 方法1
- 方法2
- 配对四格表资料的卡方检验
- 四格表资料的 Fisher 确切概率法
- 行 x 列表资料的卡方检验
-
- 多个样本率的比较
- 样本构成比的比较
- 双向无序分类资料的关联性检验
- 双向有序分组资料的线性趋势检验
- 多个样本率间的多重比较
- Cochran-Mantel-Haenszel 卡方统计量检验
- 频数分布拟合优度卡方检验
不同类型卡方检验的选择
课本中关于四格表资料的卡方检验的方法选择以及R x C表资料的检验方法选择做了非常好的总结,在这里一并和大家分享一下:
四格表资料的方法选择:
- 当 n(样本量)≥40 且所有的T(期望频数)≥5时,用χ2检验的基本公式或四格表资料之χ2检验的专用公式;当P ≈ α时,改用四格表资料的 Fisher 确切概率法;
- 当 n≥40 但有 1≤T<5 时,用四格表资料χ2检验的校正公式,或改用四格表资料的 Fisher 确切概率法。
- 当 n<40,或 T<1时,用四格表资料的 Fisher 确切概率法。
R×C表资料的分类及其检验方法的选择:
R×C表资料可以分为双向无序、单向有序、双向有序属性相同和双向有序属性不同4类。
- 双向无序R×C表资料 R×C表资料中两个分类变量皆为无序分类变量对于该类资料,若研究目的为多个样本率(或构成比)的比较,可用行×列表资料的χ2检验:若研究目的为分析两个分类变量之间有无关联性以及关系的密切程度时,可用行×列表资料的χ2检验以及Pearson列联系数进行分析。
- 单向有序R×C表资料 有两种形式。一种是R×C表资料中的分组变量(如年龄)是有序的,而指标变量(如传染病的类型)是无序的。其研究目的通常是分析不同年龄组各种传染病的构成情况,此种单向有序R×C表资料可用行×列表资料的χ2检验进行分析。另一种情况是R×C表资料中的分组变量
(如疗法)为无序的,而指标变量(如疗效按等级分组)是有序的。其研究目的为比较不同疗法的疗效,此种单向有序R×C表资料宜用秩转换的非参数检验进行分析。 - 双向有序属性相同的R×C表资料 R×C表资料中的两个分类变量皆为有序且属性相同。实际上是配对四格表资料的扩展,即水平数≥3的配伍资料,如用两种检测方法同时对同一批样品的测定结果。其研究目的通常是分析两种检测方法的一致性,此时宜用一致性检验或称Kappa检验;也可用特殊模型分
析方法(可用SAS软件)。 - 双向有序属性不同的R×C表资料 R×C表资料中两个分类变量皆为有序的,但属性不同。对于该类资料,若研究目的为分析不同年龄组患者疗效之间有无差别时,可把它视为单向有序R×C表资料,选用秩转换的非参数检验;若研究目的为分析两个有序分类变量间是否存在相关关系,宜用等级相关分析:若研究目的为分析两个有序分类变量间是否存在线性变化趋势,宜用前述的双向有序分组资料的线性趋势检验(test for linear trend)。
四格表资料的卡方检验
使用课本例7-1的数据。
首先是构造数据,本次数据自己从书上摘录。。
ID<-seq(1,200)
treat<-c(rep("treated",104),rep("placebo",96))
treat<- factor(treat)
impro<-c(rep("marked",99),rep("none",5),rep("marked",75),rep("none",21))
impro<-as.factor(impro)
data1<-data.frame(ID,treat,impro)

str(data1)
## 'data.frame':	200 obs. of  3 variables:
##  $ ID   : int  1 2 3 4 5 6 7 8 9 10 ...
##  $ treat: Factor w/ 2 levels "placebo","treated": 2 2 2 2 2 2 2 2 2 2 ...
##  $ impro: Factor w/ 2 levels "marked","none": 1 1 1 1 1 1 1 1 1 1 ...
数据一共3列,第一列是id,第二列是治疗方法,第三列是等级(有效和无效)。
简单看下各组情况:
table(data1$treat,data1$impro)
##
##           marked none
##   placebo     75   21
##   treated     99    5
做卡方检验有2种方法,分别演示:
方法1
直接使用 gmodels包里面的 CrossTable()函数,非常强大,直接给出所有结果,和SPSS差不多。
library(gmodels)

CrossTable(data1$treat, data1$impro, digits = 4, expected = T, chisq = T, fisher = T, mcnemar = T, format = "SPSS")
##
##    Cell Contents
## |-------------------------|
## |                   Count |
## |         Expected Values |
## | Chi-square contribution |
## |             Row Percent |
## |          Column Percent |
## |           Total Percent |
## |-------------------------|
##
## Total Observations in Table:  200
##
##              | data1$impro
##  data1$treat |   marked  |     none  | Row Total |
## -------------|-----------|-----------|-----------|
##      placebo |       75  |       21  |       96  |
##              |  83.5200  |  12.4800  |           |
##              |   0.8691  |   5.8165  |           |
##              |  78.1250% |  21.8750% |  48.0000% |
##              |  43.1034% |  80.7692% |           |
##              |  37.5000% |  10.5000% |           |
## -------------|-----------|-----------|-----------|
##      treated |       99  |        5  |      104  |
##              |  90.4800  |  13.5200  |           |
##              |   0.8023  |   5.3691  |           |
##              |  95.1923% |   4.8077% |  52.0000% |
##              |  56.8966% |  19.2308% |           |
##              |  49.5000% |   2.5000% |           |
## -------------|-----------|-----------|-----------|
## Column Total |      174  |       26  |      200  |
##              |  87.0000% |  13.0000% |           |
## -------------|-----------|-----------|-----------|
##
##
## Statistics for All Table Factors
##
##
## Pearson's Chi-squared test
## ------------------------------------------------------------
## Chi^2 =  12.85707     d.f. =  1     p =  0.0003362066
##
## Pearson's Chi-squared test with Yates' continuity correction
## ------------------------------------------------------------
## Chi^2 =  11.3923     d.f. =  1     p =  0.0007374901
##
##
## McNemar's Chi-squared test
## ------------------------------------------------------------
## Chi^2 =  50.7     d.f. =  1     p =  1.076196e-12
##
## McNemar's Chi-squared test with continuity correction
## ------------------------------------------------------------
## Chi^2 =  49.40833     d.f. =  1     p =  2.078608e-12
##
##
## Fisher's Exact Test for Count Data
## ------------------------------------------------------------
## Sample estimate odds ratio:  0.1818332
##
## Alternative hypothesis: true odds ratio is not equal to 1
## p =  0.0005286933
## 95% confidence interval:  0.05117986 0.5256375
##
## Alternative hypothesis: true odds ratio is less than 1
## p =  0.0002823226
## 95% confidence interval:  0 0.4569031
##
## Alternative hypothesis: true odds ratio is greater than 1
## p =  0.9999541
## 95% confidence interval:  0.06281418 Inf
##
##
##
##        Minimum expected frequency: 12.48
可以看到这个函数直接给出所有结果,根据需要自己选择合适的即可。
本例符合pearson卡方,卡方值为12.85707,p<0.01,和课本一致。
方法2
先把数据变成2x2列联表,然后用 chisq.test函数做
mytable <- table(data1$treat,data1$impro)

mytable
##
##           marked none
##   placebo     75   21
##   treated     99    5
chisq.test(mytable,correct = F) # 和SPSS一样
##
## 	Pearson's Chi-squared test
##
## data:  mytable
## X-squared = 12.857, df = 1, p-value = 0.0003362
这个结果和课本也是一致的,和SPSS算出来的也是一样的。
四格表资料卡方检验的专用公式/四格表资料卡方检验的校正公式/配对四格表资料的卡方检验/四格表资料的Fisher精确概率法,都可以用方法1可直接解决。
下面使用R语言自带的chisq.test()函数进行演示。
使用课本例7-2的数据,这是一个连续校正卡方检验。
per <- matrix(c(46,6,18,8),
              nrow = 2, byrow = T,
              dimnames = list(group = c("胞磷胆碱","神经节苷脂"),
                              effect = c("有效","无效")
                              )
              )

per
##             effect
## group        有效 无效
##   胞磷胆碱     46    6
##   神经节苷脂   18    8
进行连续校正的卡方检验:
chisq.test(per, correct = T)
##
## 	Pearson's Chi-squared test with Yates' continuity correction
##
## data:  per
## X-squared = 3.1448, df = 1, p-value = 0.07617
配对四格表资料的卡方检验
使用课本例7-3的数据。
ana <- matrix(c(11,12,2,33), nrow = 2, byrow = T,
              dimnames = list(免疫荧光 = c("阳性","阴性"),
                              乳胶凝集 = c("阳性","阴性")
                              )
              )

ana
##         乳胶凝集
## 免疫荧光 阳性 阴性
##     阳性   11   12
##     阴性    2   33
配对四个表资料需要用McNemar检验:
mcnemar.test(ana, correct = T)
##
## 	McNemar's Chi-squared test with continuity correction
##
## data:  ana
## McNemar's chi-squared = 5.7857, df = 1, p-value = 0.01616
四格表资料的 Fisher 确切概率法
使用课本例7-4的数据。
hbv <- matrix(c(4,18,5,6), nrow = 2, byrow = T,
              dimnames = list(组别 = c("预防注射组","非预防组"),
                              效果 = c("阳性","阴性")
                              )
              )
hbv
##             效果
## 组别       阳性 阴性
##   预防注射组    4   18
##   非预防组      5    6
进行 Fisher 检验:
fisher.test(hbv)
##
## 	Fisher's Exact Test for Count Data
##
## data:  hbv
## p-value = 0.121
## alternative hypothesis: true odds ratio is not equal to 1
## 95 percent confidence interval:
##  0.03974151 1.76726409
## sample estimates:
## odds ratio
##  0.2791061
P值为0.121,和课本一样。
行 x 列表资料的卡方检验
行 x 列表资料的卡方检验有很多种情况,不是所有的列联表资料都可以直接用卡方检验,大家要注意甄别!方法选择可以参考本篇开头部分。
多个样本率的比较
使用课本例7-6的数据。
首先是构造数据,本次数据直接读取,也可以自己手动摘录。
df <- foreign::read.spss("./例07-06物理药物外用膏用.sav", to.data.frame = T,reencode = "utf-8")
## re-encoding from utf-8

str(df)
## 'data.frame':	6 obs. of  3 variables:
##  $ .Ʒ.: Factor w/ 3 levels ".....Ʒ...","ҩ........",..: 1 1 2 2 3 3
##  $ ..Ч: Factor w/ 2 levels "..Ч","..Ч_duplicated_2": 1 2 1 2 1 2
##  $ f  : num  199 7 164 18 118 26
##  - attr(*, "variable.labels")= Named chr(0)
##   ..- attr(*, "names")= chr(0)
数据一共3列,第1列是疗法,第2列是有效无效,第3列是频数.
进行 行 x 列表资料的卡方检验,首先要对数据格式转换一下,变成 table或者 矩阵:
M <- matrix(df$f,nrow = 3,byrow = T,
            dimnames = list(trt = c("物理", "药物", "外用"),
                            effect = c("有效","无效")))

M
##       effect
## trt    有效 无效
##   物理  199    7
##   药物  164   18
##   外用  118   26
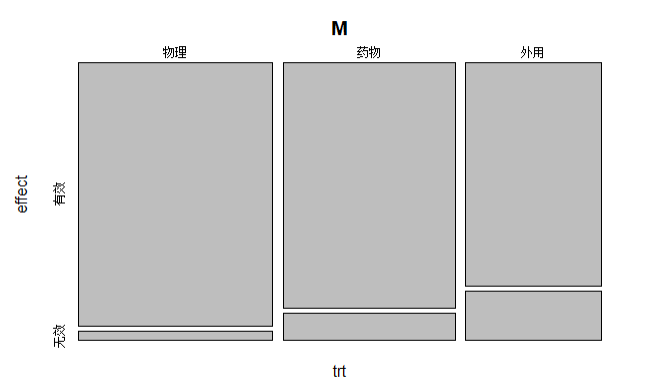
这里教大家一个可视化列联表资料非常好用的马赛克图:
mosaicplot(M)
进行 行 x 列表资料的卡方检验:
kf <- chisq.test(M, correct = F)

kf
##
## 	Pearson's Chi-squared test
##
## data:  M
## X-squared = 21.038, df = 2, p-value = 2.702e-05
多个样本率的比较也可以使用以下函数进行检验:
# 只适用于两列的,类似于 有效/无效 这种!
prop.test(M, correct = TRUE)
##
## 	3-sample test for equality of proportions without continuity correction
##
## data:  M
## X-squared = 21.038, df = 2, p-value = 2.702e-05
## alternative hypothesis: two.sided
## sample estimates:
##    prop 1    prop 2    prop 3
## 0.9660194 0.9010989 0.8194444
可以看到两种结果是一样的,和课本一致的!
样本构成比的比较
使用课本例7-7的数据。
ace <- matrix(c(42,48,21,30,72,36),nrow = 2,byrow = T,
              dimnames = list(dn = c("dn组","非dn组"),
                              idi = c("dd","id","ii")
                              )
              )
ace
##         idi
## dn       dd id ii
##   dn组   42 48 21
##   非dn组 30 72 36
进行卡方检验:
chisq.test(ace, correct = F)
##
## 	Pearson's Chi-squared test
##
## data:  ace
## X-squared = 7.9127, df = 2, p-value = 0.01913
卡方值为7.91,和课本一致。
双向无序分类资料的关联性检验
使用课本例例7-8的数据。
blood <- matrix(c(431,490,902,388,410,800,495,587,950,137,179,32),
                nrow = 4,byrow = T,
                dimnames = list(abo = c("o","a","b","ab"),
                                mn = c("m","n","mn")
                                )
                )
blood
##     mn
## abo    m   n  mn
##   o  431 490 902
##   a  388 410 800
##   b  495 587 950
##   ab 137 179  32
进行 关联性检验:
chisq.test(blood,correct = F)
##
## 	Pearson's Chi-squared test
##
## data:  blood
## X-squared = 213.16, df = 6, p-value < 2.2e-16
计算列联系数:
library(vcd)
## Loading required package: grid

assocstats(blood)
##                     X^2 df P(> X^2)
## Likelihood Ratio 248.14  6        0
## Pearson          213.16  6        0
##
## Phi-Coefficient   : NA
## Contingency Coeff.: 0.188
## Cramer's V        : 0.136
Pearson列联系数是0.188,和课本一样。
双向有序分组资料的线性趋势检验
使用课本例7-9的数据。
ather <- matrix(c(70,22,4,2,27,24,9,3,16,23,13,7,9,20,15,14),
                nrow = 4,byrow = T,
                dimnames = list(age = c("20~","30~","40~","≥50"),
                                level = c("-","+","++","+++")
                                )
                )
ather
##      level
## age    -  + ++ +++
##   20~ 70 22  4   2
##   30~ 27 24  9   3
##   40~ 16 23 13   7
##   ≥50  9 20 15  14
进行卡方检验:
chisq.test(ather)
##
## 	Pearson's Chi-squared test
##
## data:  ather
## X-squared = 71.432, df = 9, p-value = 7.97e-12
但这种情况下做这种卡方检验并不能说明什么问题,课本是看两者之间有没有线性趋势,我们可以直接用lm()函数做,把age作为自变量,把level作为因变量即可,由于没有原始数据,这里就不演示了。
多个样本率间的多重比较
主要有卡方分割法、Scheffe可信区间法、SNK法等,这里主要演示卡方分割法。
其实非常简单,就是把多个组手动拆分为多个 两个组,分别进行卡方检验,和P值比较,只不过这里的P值不再是0.05,而是和组数(比较次数)有关。
使用例7-10的数据。
df <- foreign::read.spss("./例07-06物理药物外用膏用.sav", to.data.frame = T,reencode = "utf-8")

M <- matrix(df$f,nrow = 3,byrow = T,
            dimnames = list(trt = c("物理", "药物", "外用"),
                            effect = c("有效","无效")))

M

Show in New Window
re-encoding from utf-8
      effect
trt    有效 无效
  物理  199    7
  药物  164   18
  外用  118   26
手动拆分,两两比较,直接取子集即可:
# 物理治疗组和药物治疗组的卡方检验
chisq.test(M[1:2,], correct = F)

	Pearson's Chi-squared test

data:  M[1:2, ]
X-squared = 6.756, df = 1, p-value = 0.009343
# 物理治疗组和外用膏药组的卡方检验
chisq.test(M[c(1,3),], correct = F)

	Pearson's Chi-squared test

data:  M[c(1, 3), ]
X-squared = 21.323, df = 1, p-value = 3.881e-06
# 药物治疗组和外用膏药组的卡方检验
chisq.test(M[2:3,], correct = F)

	Pearson's Chi-squared test

data:  M[2:3, ]
X-squared = 4.591, df = 1, p-value = 0.03214
可以看到和课本是一样的。
这时的 P’ = P / (K * (K - 1) / 2 + 1),K是组数,一般情况下P=0.05,所以P’ = 0.05/(3*(3-1)/2+1) = 0.0125,上面3个卡方分析的P值和0.0125比较即可!
Cochran-Mantel-Haenszel 卡方统计量检验
中文名又叫行均分检验,常用于按照某个变量进行分层后的检验,这个方法课本上说用于检验两个有序分类变量是否存在线性相关,但实际上用途很广泛,比如因变量是有序变量的单向有序列联表,也可以用。
使用课本例7-12的数据。
这个数据有3个变量,首先是年龄,根据年龄分成两层,然后是是否心肌梗死和是否口服避孕药,我们可以直接把这个数据录入成3维array的形式:
myo <- array(c(17,47,
               121,944,
               12,158,
               14,663),
             dim = c(2,2,2),
             dimnames = list(心肌梗死 = c("病例","对照"),
                             口服避孕药 = c("是","否"),
                             年龄分层 = c("<40岁","≥40岁")
                             )
             )
myo
## , , 年龄分层 = <40岁
##
##         口服避孕药
## 心肌梗死 是  否
##     病例 17 121
##     对照 47 944
##
## , , 年龄分层 = ≥40岁
##
##         口服避孕药
## 心肌梗死  是  否
##     病例  12  14
##     对照 158 663
这样就能直接进行Cochran-Mantel-Haenszel检验了,这个检验的函数是R语言自带的,不需要另外的包:
mantelhaen.test(myo,correct = F)
##
## 	Mantel-Haenszel chi-squared test without continuity correction
##
## data:  myo
## Mantel-Haenszel X-squared = 24.184, df = 1, p-value = 8.755e-07
## alternative hypothesis: true common odds ratio is not equal to 1
## 95 percent confidence interval:
##  1.930775 4.933840
## sample estimates:
## common odds ratio
##          3.086444
这样就得到结果了,这个结果和课本也是一样的。
课本还介绍了Breslow-Day对各层的效应值进行齐性检验,这个检验可以通过DescTools包实现:
library(DescTools)
## Registered S3 method overwritten by 'DescTools':
##   method         from
##   reorder.factor gdata

BreslowDayTest(myo)
##
## 	Breslow-Day test on Homogeneity of Odds Ratios
##
## data:  myo
## X-squared = 0.23409, df = 1, p-value = 0.6285
结果也是和课本一模一样。
如果你的是原始数据的形式,也是很简单的,我们构造一个和上面数据一样的原始数据:
myoo <- data.frame(年龄分层 = c(rep("<40岁",1129),rep("≥40岁",847)),
                   心肌梗死 = c(rep("病例",64),rep("对照",1065),
                                rep("病例",170),rep("对照",677)
                                ),
                   口服避孕药 = c(rep("是",17),rep("否",47),
                                  rep("是",121),rep("否",944),
                                  rep("是",12),rep("否",158),
                                  rep("是",14),rep("否",663)
                                  )
                   )

# 分类变量变为因子型
myoo$年龄分层 <- factor(myoo$年龄分层,levels = c("<40岁","≥40岁"))
myoo$心肌梗死 <- factor(myoo$心肌梗死, levels = c("病例","对照"))
myoo$口服避孕药 <- factor(myoo$口服避孕药, levels = c("是","否"))

head(myoo)
##   年龄分层 心肌梗死 口服避孕药
## 1    <40岁     病例         是
## 2    <40岁     病例         是
## 3    <40岁     病例         是
## 4    <40岁     病例         是
## 5    <40岁     病例         是
## 6    <40岁     病例         是
用xtabs查看数据,结果和我们的array的形式是一样的:
myoo.tab <- xtabs(~口服避孕药+心肌梗死+年龄分层,data = myoo)
myoo.tab
## , , 年龄分层 = <40岁
##
##           心肌梗死
## 口服避孕药 病例 对照
##         是   17  121
##         否   47  944
##
## , , 年龄分层 = ≥40岁
##
##           心肌梗死
## 口服避孕药 病例 对照
##         是   12   14
##         否  158  663
这样就可以直接进行Cochran-Mantel-Haenszel检验了:
mantelhaen.test(myoo.tab, correct = F)
##
## 	Mantel-Haenszel chi-squared test without continuity correction
##
## data:  myoo.tab
## Mantel-Haenszel X-squared = 24.184, df = 1, p-value = 8.755e-07
## alternative hypothesis: true common odds ratio is not equal to 1
## 95 percent confidence interval:
##  1.930775 4.933840
## sample estimates:
## common odds ratio
##          3.086444
结果也是一样的。
还可用woolf法检验不同分层之间的效应值有没有统计学显著性,通过使用?mantelhaen.test查看帮助文档,作者直接给了一个现成的计算方法:
woolf <- function(x) {
  x <- x + 1 / 2
  k <- dim(x)[3]
  or <- apply(x, 3, function(x) (x[1,1]*x[2,2])/(x[1,2]*x[2,1]))
  w <-  apply(x, 3, function(x) 1 / sum(1 / x))
  1 - pchisq(sum(w * (log(or) - weighted.mean(log(or), w)) ^ 2), k - 1)
}

woolf(myoo.tab)
## [1] 0.6400154
直接给出了P值。
频数分布拟合优度卡方检验
使用课本例7-13的数据。
R语言做卡方拟合优度检验非常简单,关键是概率的计算,这里我们直接用课本中的概率。
x <- c(26,51,75,63,38,17,9)
p <- c(0.0854,0.2102,0.2585,0.2120,0.1304,0.0641,0.0394)

chisq.test(x=x, p =p)
##
## 	Chi-squared test for given probabilities
##
## data:  x
## X-squared = 2.0377, df = 6, p-value = 0.9162
结果和课本非常接近。
这里贴一个网络教程的概率计算方法:
x<-0:6
y<-c(26,51,75,63,38,17,9)
mean<-mean(rep(x,y))
q<-ppois(x,mean)
n<-length(y)
p<-c()
p[1]<-q[1]
p[n]<-1-q[n-1]
for(i in 2:(n-1))
  p[i]<-q[i]-q[i-1]
chisq.test(y, p=p,correct=F)

	Chi-squared test for given probabilities

data:  y
X-squared = 2.0569, df = 6, p-value = 0.9144
结果和课本非常接近。
本文首发于公众号:医学和生信笔记,完美观看体验请至公众号查看本文。
医学和生信笔记,专注R语言在临床医学中的使用,R语言数据分析和可视化。

