使用PCA压缩图像(python实现)
import numpy as np
import matplotlib.pyplot as plt
import pandas as pd
from scipy.io import loadmat
from skimage import io
from sklearn.decomposition import PCA
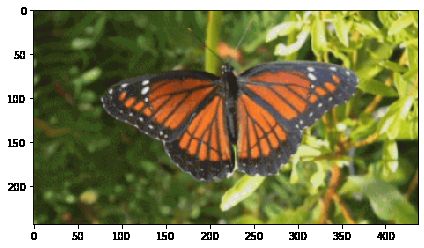
A=io.imread('butterfly.bmp')
A=A/255 #RGB的三个值[0,255],将它们范围设置为[0,1]
io.imshow(A)
plt.show()
A.shape
(243, 437, 3)
A[:,:,0].shape
(243, 437)
io.imshow(A[:,:,0])
plt.show()

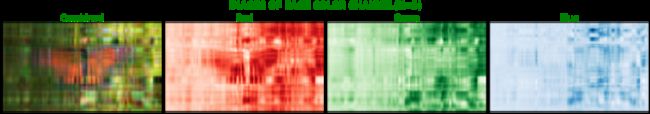
fig,ax_array=plt.subplots(nrows=1,ncols=4,figsize=(32,32))
cmap_list=['Reds','Greens','Blues']
ax_array[0].imshow(A[:,:,:])
ax_array[0].set_xticks([])
ax_array[0].set_yticks([])
ax_array[0].set_title("Combined", size = 30,color='w')
for i in range(3):
    ax_array[i+1].imshow(A[:,:,i],cmap=cmap_list[i])
    ax_array[i+1].set_xticks([])
    ax_array[i+1].set_yticks([])
    ax_array[i+1].set_title(cmap_list[i][:-1], size = 30,color='w')
plt.tight_layout()
fig.suptitle("IMAGES OF EACH COLOR CHANNEL", size = 30, y = 0.6, fontweight = "bold",color='w')
plt.show()
R,G,B=A[:,:,0],A[:,:,1],A[:,:,2]
R.shape,G.shape,B.shape
((243, 437), (243, 437), (243, 437))
主成分分析
思路是利用矩阵的特征值分解,根据特征值的大小确定各特征轴在数据中的权重,特征值非常小的成分可以忽略不计,从而实现数据降维或者数据压缩。矩阵(图像)X,其维度为 n × m n\times m n×m,可以将其理解为具有 n n n个特征, m m m个样本的数据,而主成分分析的目的就是降低特征数量(每行对应一个特征,每列对应一个样本)的数量,去掉冗余特征。现在,要对矩阵作某种线性变换,使其维度变为 l × m ( l < n ) l\times m(lX相乘,且使 ( l < n ) (l
根据线性代数知识,可以很容易的知道这个正变换(实现压缩)矩阵的维度是 l × n l\times n l×n,对压缩矩阵作反变换(实现解压)操作,就可以得到有损压缩后的矩阵 X ( l ) X^{(l)} X(l),并且反变换矩阵的维度是 n × l n\times l n×l
下面的代码中矩阵为 n _ s a m p l e s × n _ f e a t u r e s n\_samples\times n\_features n_samples×n_features,每列是一个特征,每一行是一个样本:
def pca_m(data,k):
    n_samples,n_features = data.shape#每列是一个特征,每一行是一个样本
    #求解一个特征的均值,即每一列的平均值,shape(n_samples,1)
    mean=(data.sum(axis=1)/n_samples).reshape(-1,1)
    # 去中心化,shape(n_samples,1)
    normal_data = data - mean
    # 得到协方差矩阵
    matrix_ = np.dot(np.transpose(normal_data),normal_data)
    eig_val,eig_vec = np.linalg.eig(matrix_)
    #得到最主要的k个特征
    eigIndex = np.argsort(eig_val)
    eigVecIndex = eigIndex[:-(k+1):-1]
    feature = eig_vec[:,eigVecIndex]

    new_data = np.dot(normal_data,feature)
    # 将降维后的数据映射回原空间
    rec_data = np.dot(new_data,np.transpose(feature))+ mean
    return rec_data
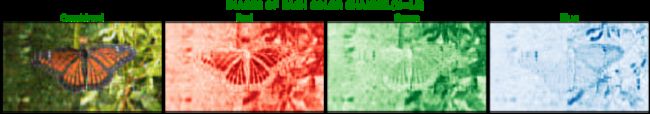
for k in range(5,150,10):
    R_new,G_new,B_new=pca_m(R,k),pca_m(G,k),pca_m(B,k)

    A_new=np.zeros(A.shape)
    A_new[:,:,0]=R_new
    A_new[:,:,1]=G_new
    A_new[:,:,2]=B_new

    fig,ax_array=plt.subplots(nrows=1,ncols=4,figsize=(32,32))
    cmap_list=['Reds','Greens','Blues']
    ax_array[0].imshow(A_new[:,:,:])
    ax_array[0].set_xticks([])
    ax_array[0].set_yticks([])
    ax_array[0].set_title("Combined", size = 30,color='g')
    for i in range(3):
        ax_array[i+1].imshow(A_new[:,:,i],cmap=cmap_list[i])
        ax_array[i+1].set_xticks([])
        ax_array[i+1].set_yticks([])
        ax_array[i+1].set_title(cmap_list[i][:-1], size = 30,color='g')
    plt.tight_layout()
    fig.suptitle("IMAGES OF EACH COLOR CHANNEL(K={})".format(k), size = 30, y = 0.6, fontweight = "bold",color='g')
    plt.show()
:5: ComplexWarning: Casting complex values to real discards the imaginary part
  A_new[:,:,0]=R_new
:6: ComplexWarning: Casting complex values to real discards the imaginary part
  A_new[:,:,1]=G_new
:7: ComplexWarning: Casting complex values to real discards the imaginary part
  A_new[:,:,2]=B_new
Clipping input data to the valid range for imshow with RGB data ([0..1] for floats or [0..255] for integers).
Clipping input data to the valid range for imshow with RGB data ([0..1] for floats or [0..255] for integers).
Clipping input data to the valid range for imshow with RGB data ([0..1] for floats or [0..255] for integers).

Clipping input data to the valid range for imshow with RGB data ([0..1] for floats or [0..255] for integers).
Clipping input data to the valid range for imshow with RGB data ([0..1] for floats or [0..255] for integers).
Clipping input data to the valid range for imshow with RGB data ([0..1] for floats or [0..255] for integers).
Clipping input data to the valid range for imshow with RGB data ([0..1] for floats or [0..255] for integers).
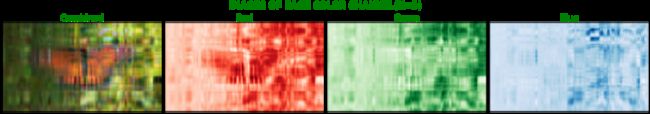
sklearn是机器学习最重要的一个库,里面包含了pca函数,试着调用一下:(不需要自己写pca函数了)
def pca(X,K):
    pca=PCA(n_components=K).fit(X)
    X_new=pca.transform(X)
    X_new = pca.inverse_transform(X_new)
    return X_new
for k in range(5,150,10):
    R_new,G_new,B_new=pca(R,k),pca(G,k),pca(B,k)

    A_new=np.zeros(A.shape)
    A_new[:,:,0]=R_new
    A_new[:,:,1]=G_new
    A_new[:,:,2]=B_new

    fig,ax_array=plt.subplots(nrows=1,ncols=4,figsize=(32,32))
    cmap_list=['Reds','Greens','Blues']
    ax_array[0].imshow(A_new[:,:,:])
    ax_array[0].set_xticks([])
    ax_array[0].set_yticks([])
    ax_array[0].set_title("Combined", size = 30,color='g')
    for i in range(3):
        ax_array[i+1].imshow(A_new[:,:,i],cmap=cmap_list[i])
        ax_array[i+1].set_xticks([])
        ax_array[i+1].set_yticks([])
        ax_array[i+1].set_title(cmap_list[i][:-1], size = 30,color='g')
    plt.tight_layout()
    fig.suptitle("IMAGES OF EACH COLOR CHANNEL(K={})".format(k), size = 30, y = 0.6, fontweight = "bold",color='g')
    plt.show()
Clipping input data to the valid range for imshow with RGB data ([0..1] for floats or [0..255] for integers).
Clipping input data to the valid range for imshow with RGB data ([0..1] for floats or [0..255] for integers).
Clipping input data to the valid range for imshow with RGB data ([0..1] for floats or [0..255] for integers).
Clipping input data to the valid range for imshow with RGB data ([0..1] for floats or [0..255] for integers).
Clipping input data to the valid range for imshow with RGB data ([0..1] for floats or [0..255] for integers).
Clipping input data to the valid range for imshow with RGB data ([0..1] for floats or [0..255] for integers).
Clipping input data to the valid range for imshow with RGB data ([0..1] for floats or [0..255] for integers).