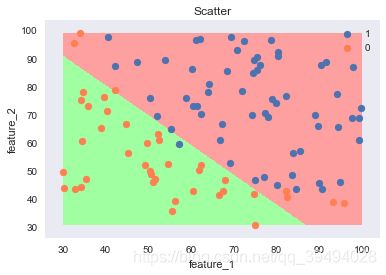
自己手撸了一遍并做了可视化,又用sklearn实现了一遍,以备遗忘。
sklearn实现
逻辑回归
from sklearn.linear_model import LogisticRegression
from sklearn.model_selection import train_test_split
import pandas as pd
import numpy as np
df=pd.read_csv('LogiReg_data.txt',names=['feature_1','feature_2','class'])
print(df.shape)
df.head(2)
(100, 3)
|
feature_1 |
feature_2 |
class |
| 0 |
34.623660 |
78.024693 |
0 |
| 1 |
30.286711 |
43.894998 |
0 |
solver参数说明
liblinear:使用了开源的liblinear库实现,内部使用了坐标轴下降法来迭代优化损失函数。不支持MvM。
lbfgs:拟牛顿法的一种,利用损失函数二阶导数矩阵即海森矩阵来迭代优化损失函数。
newton-cg:也是牛顿法的一种,利用损失函数二阶导数矩阵即海森矩阵来迭代优化损失函数。
sag:即随机平均梯度下降,是梯度下降法的变种,和普通梯度下降法的区别是每次迭代仅仅用一部分的样本来计算梯度,适合于样本数据多的时候。
x=df[['feature_1','feature_2']]
y=df['class']
x_train,x_test,y_train,y_test=train_test_split(x,y,test_size=0.3,shuffle=True,random_state=1)
lgr=LogisticRegression(penalty='l2',
dual=False,
C=1,
multi_class='auto',
random_state=1,
max_iter=100,
solver='liblinear',
class_weight=None
)
lgr.fit(x_train,y_train)
print('类别:',lgr.classes_)
print('权重参数:',lgr.coef_)
print('截距:',lgr.intercept_)
print('迭代次数:',lgr.n_iter_)
score=lg.score(x_test,y_test)
print('准确率:',score)
y_pred=lgr.predict(x_test)
y_proba=lgr.predict_proba(x_test)
print('概率',y_proba[:3])
类别: [0 1]
权重参数: [[0.03687707 0.02384736]]
截距: [-3.15062349]
迭代次数: [12]
准确率: 0.5333333333333333
概率 [[0.14271796 0.85728204]
 [0.1210817  0.8789183 ]
 [0.39545264 0.60454736]]
逻辑回归超参数估计
from sklearn.linear_model import LogisticRegressionCV
cs=[0.001,0.01,0.1,1,10]
lrcv=LogisticRegressionCV(Cs=cs,
cv=3,
scoring=None,
solver='newton-cg',
max_iter=100,
penalty='l2',
multi_class='auto'
)
lrcv.fit(x_train,y_train)
print('最佳权重参数及截距:',lrcv.coef_,lrcv.intercept_)
print('最佳惩罚力度:',lrcv.C_)
y_pred=lrcv.predict(x_test)
score=lrcv.score(x_test,y_test)
print('准确率:',score)
最佳权重参数及截距: [[0.07874727 0.07008375]] [-8.94279806]
最佳惩罚力度: [0.001]
准确率: 0.9
手动实现
import pandas as pd
import numpy as np
import matplotlib.pyplot as plt
import matplotlib as mpl
import seaborn as sns
from sklearn.preprocessing import StandardScaler
df=pd.read_csv('LogiReg_data.txt',names=['feature_1','feature_2','class'])
ss=StandardScaler()
x=ss.fit_transform(df[['feature_1','feature_2']])
y=df['class'].values
class LogisticRegression(object):
def sigmoid(self,x):
theta=LogisticRegression.theta
return 1/(1+np.exp(-x.dot(theta)))
def h(self,X):
return np.apply_along_axis(self.sigmoid,1,X)
def gd_fit(self,X,y,n,a):
X=np.c_[X,np.ones((len(x),1))]
LogisticRegression.theta=np.ones((len(X[0]),1)).ravel()
for i in range(n):
grad=X.T.dot(self.h(X).ravel()-y)
theta=LogisticRegression.theta-a*grad
LogisticRegression.theta=theta
def newton_fit(self,X,y,n):
X=np.c_[X,np.ones((len(x),1))]
LogisticRegression.theta=np.ones((len(X[0]),1)).ravel()
for i in range(n):
try:
hessian=X.T.dot(np.diag(self.h(X).ravel())).dot(np.diag(1-self.h(X).ravel())).dot(X)
grad=X.T.dot(self.h(X).ravel()-y)
step=np.linalg.inv(hessian).dot(grad)
theta=LogisticRegression.theta-step
except:
break
LogisticRegression.theta=theta
def predict(self,X,threshold):
LogisticRegression.threshold=threshold
X=np.c_[X,np.ones((len(X),1))]
y=np.where(self.h(X).ravel()>threshold,1,0)
return y
def predict_proba(self,X):
X=np.c_[X,np.ones((len(X),1))]
return self.h(X).ravel()
def score(self,y_pred,y_true):
y_pred_true=y_pred[y_pred==y_true]
tp=len(y_pred_true[y_pred_true==1])
return tp/(len(y_pred[y_pred==1]))
def auc(self,proba):
proba=np.sort(proba)
threshold=LogisticRegression.threshold
m=proba[np.where(proba>threshold)].shape[0]
n=proba[np.where(proba<threshold)].shape[0]
down=m*n
up=np.where(proba>threshold)[0].sum()-m*(m+1)/2
return up/down
n=1000
a=0.1
threshold=0.5
lr=LogisticRegression()
lr.newton_fit(x,y,n)
theta=lr.theta
print('theta:',theta)
y_pred=lr.predict(x,threshold)
score=lr.score(y_pred,y)
print('精度:',score)
proba=lr.predict_proba(x)
auc=lr.auc(proba)
print('AUC:',auc)
theta: [1.94148493 1.78891891 0.9754304 ]
精度: 0.9047619047619048
AUC: 0.972972972972973
N=500
M=500
f1_min,f2_min=df[['feature_1','feature_2']].min()
f1_max,f2_max=df[['feature_1','feature_2']].max()
f1=np.linspace(f1_min,f1_max,N)
f2=np.linspace(f2_min,f2_max,M)
m1,m2=np.meshgrid(f1,f2)
x_show=np.stack((m1.flat,m2.flat),axis=1)
x_show=ss.fit_transform(x_show)
y_show=lr.predict(x_show,threshold)
sns.set()
cm_light = mpl.colors.ListedColormap(['#A0FFA0', '#FFA0A0'])
plt.pcolormesh(m1,m2,y_show.reshape(m1.shape),cmap=cm_light)
plt.scatter(df.loc[df['class']==1,'feature_1'],df.loc[df['class']==1,'feature_2'],label='1')
plt.scatter(df.loc[df['class']==0,'feature_1'],df.loc[df['class']==0,'feature_2'],c='coral',label='0')
plt.title('Scatter')
plt.xlabel('feature_1')
plt.ylabel('feature_2')
plt.legend()
plt.show()

