DISK:Learning local features with policy gradient
DISK:Learning local features with policy gradient
policy gradient:策略梯度算法,强化学习内容;
发表时间:[Submitted on 24 Jun 2020 (v1), last revised 27 Oct 2020 (this version, v2)]
发表期刊/会议:Computer Vision and Pattern Recognition
论文地址:https://arxiv.org/abs/2006.13566
代码地址:https://github.com/cvlab-epfl/disk
0 摘要
稀疏关键点的选择和匹配具有离散性,所以提取局部特征的模型很难以端到端的方式进行学习;
本文提出了DISK算法(DIScrete Keypoints),利用强化学习来优化端到端的学习;
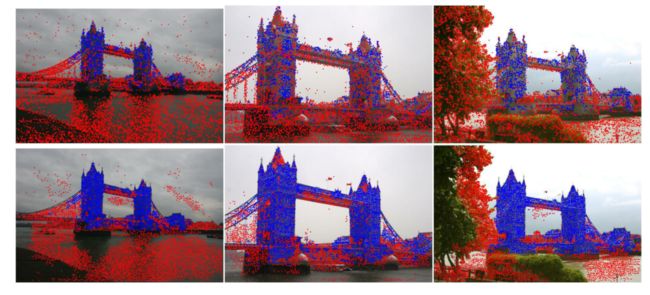
本文的方法可以非常密集的提取特征关键点,同时能辨别特征点之间的区别,挑战了"什么是好的关键点"的普遍假说,如图1所示。

图左展示了Upright Root-SIFT的关键点,图右展示了DISK的关键点;蓝色:landmarks以及对应的关键点;红色:不是landmarks的关键点;
DISK可以发现更多的关键点,并且与landmarks更加符合;
注:
SfM:三维重构的一种方法(Structure from motion);
Sacre Coeur:圣心堂,位于巴黎;
COLMAP :一个用于几何重建的软件;
Upright Root-SIFT:SIFT的一个变种;
1 简介
自SIFT算法以来,如何提取局部特征一直受到重视;
如何选取关键点(关键点的质量)以及计算的复杂度问题变得非常棘手;
本文的贡献:一种新的端到端可训练的方法来学习依赖于policy gradient的特征,能实现更好的性能。
2 相关工作
传统方法三个步骤:寻找关键点-估计关键点的方向-计算描述符,如SIFT、SURF等;
非传统的端到端的方法方面的工作;
最近的三种方法试图弥补训练和推理之间的差距来解决问题;
3 方法
给定图像A与图像B,我们的目标是从A和B中提取一系列的特征点 F A F_A FA和 F B F_B FB,并在它们之间形成匹配 M A ← → B M_{A←→B} MA←→B。定义一些变量:
P ( F I ∣ I , θ F ) P(F_I|I,θ_F) P(FI∣I,θF):I为图像, θ F θ_F θF为检测参数, F I F_I FI是特征,P就是图像I上以 θ F θ_F θF为参数进行检测后,特征 F I F_I FI的分布情况;
P ( M A ← → B ∣ F A , F B , θ M ) P(M_{A←→B}|F_A,F_B,θ_M) P(MA←→B∣FA,FB,θM): θ M θ_M θM表示匹配参数,P表示使用参数 θ M θ_M θM在图A,B特征上的匹配分布情况;
为了最大化 P ( M A ← → B ∣ A , B , θ ) P(M_{A←→B}|A,B,θ) P(MA←→B∣A,B,θ),需要计算积分、倒数,非常的棘手;本文通过蒙特卡罗采样(Monte Carlo sampling)和梯度下降(gradient descent)来解决这个问题。
3.1 特征分布 P ( F I ∣ I , θ F ) P(F_I|I,θ_F) P(FI∣I,θF)
本文提取特征的backbone基于U-Net,1个输出通道用于检测(feature map用K表示,代码里叫heatmap),N个输出通道用于描述(根据SIFT的经验,此处N = 128,feature map用N表示,代码里叫descriptors),提取出的特征表示为F = {K,D};
步骤:
-
1:对heatmap的裁剪。
- K被划分为h × h个小格子(代码里是v × v,v=self.window=8),在每个格子最多选取一个特征,格子记为 K u K^u Ku,并用softmax归一化;
-
2:计算特征分布。
- P s ( p ∣ K u ) = s o f t m a x ( K u ) p P_s(p|K^u)=softmax(K^u)_p Ps(p∣Ku)=softmax(Ku)p:像素p在单元格u的概率分布;
- 像素p的detection proposal也可能被拒绝;
- 如果假设被接受: P a ( a c c e p t p ∣ K u ) = σ ( K p u ) P_a(accept_p|K^u)=σ(K^u_p) Pa(acceptp∣Ku)=σ(Kpu),其中σ代表sigmoid;
- P s P_s Ps模拟了一组不同位置的相对偏好, P a P_a Pa模拟了位置p的绝对质量。
- 因此,像素p处采样的一个特征的总概率为 P ( p ∣ K u ) = s o f t m a x ( K u ) p ⋅ σ ( K p u ) P(p|K^u)=softmax(K^u)_p·σ(K^u_p) P(p∣Ku)=softmax(Ku)p⋅σ(Kpu);
- (注:代码里用对数log将乘法变成加法 a = b × c=> l o g a = l o g b + l o g c log_a = log_b + log_c loga=logb+logc);
-
3:描述符与位置特征联系起来。
- 只要知道特征的位置 { p 1 , p 2 , . . . } \{p_1,p_2,... \} {p1,p2,...},将位置特征和 l 2 l_2 l2规范化后的描述符联系起来,就可以计算特征 F I = { ( p 1 ∣ D ( p 1 ) ) , ( p 2 , D ( P 2 ) ) , . . . } F_I=\{ (p_1|D(p_1)),(p2,D(P_2)),...\} FI={(p1∣D(p1)),(p2,D(P2)),...}。
在推理的时候,用arg max代替softmax,将sigmoid替换为sign function;

图2展示了在推理时用NMS取代训练时的单元格采样的好处。对于图像中的感兴趣区域(图左红框圈出),中间的图显示NMS选出的特征,图右对中间的图进行网格分割并绘制成热图。中间的图关键点按分数排序:红色>橙色>黄色。右图中每个单元格最多包含两个非常显著的特征(红色),训练时的每个单元格最多只有一个特征;
注:
nms:Non-Maxima Suppression,用在推理的时候(代码里用nms表示);
sample: Grid-based sampling,用在训练的时候(代码里用rng表示);
用训练好的框架进行特征提取:
3.2 匹配分布 P ( M A ← → B ∣ A , B , θ ) P(M_{A←→B}|A,B,θ) P(MA←→B∣A,B,θ)
从3.1以及计算出 F A F_A FA和 F B F_B FB,计算特征描述符的 l 2 l_2 l2范数距离来获得一个距离矩阵 d d d,然后生成匹配。
避免由于图像中的重复而匹配错误对于匹配至关重要,有两种方法可以解决:
- 循环一致匹配(cycle-consistent match):强制两个特征在描述符空间中是彼此最近的邻居;
- 比率检验(ratio test):如果第一近邻和第二近邻之间的距离之比超过阈值,则拒绝匹配;
但以上两种方法不易微,本文采用松弛循环一致匹配( relax cycle-consistent matching)。
在距离矩阵 d d d的行上,对于特征 F A , i F_{A,i} FA,i定义A到B的匹配A->B(正向匹配 forward);
在距离矩阵 d d d的列上,对于特征 F B , j F_{B,j} FB,j定义B到A的匹配A<-B(逆向匹配 reverse);
正向匹配定义为: P A → B ( j ∣ d , i ) = s o f t m a x ( − θ M d ( i , ⋅ ) ) j P_{A→B}(j|d,i)=softmax(-θ_Md(i,·))_j PA→B(j∣d,i)=softmax(−θMd(i,⋅))j, θ M θ_M θM:超参;
逆向匹配:把正向匹配的矩阵 d d d换为 d T d^T dT。
如果正向匹配=逆向匹配,则采用。
给定特征 F A F_A FA和 F B F_B FB,可以精确地计算出任何特定匹配的概率: P ( i ← → j ) = P A → B ( i ∣ d , j ) ⋅ P A ← B ( j ∣ d , i ) P(i←→j)=P_{A→B}(i|d,j)·P_{A←B}(j|d,i) P(i←→j)=PA→B(i∣d,j)⋅PA←B(j∣d,i).
奖励函数 R ( M A ← → B ) R(M_{A←→B}) R(MA←→B):
总奖励=分奖励之和;
3.3 奖励函数 R ( M A ← → B ) R(M_{A←→B}) R(MA←→B)
对匹配正确的点给予 λ t p λ_{tp} λtp的奖励(实验中 λ t p = 1 λ_{tp}=1 λtp=1);
对匹配错误的点给予 λ f p λ{fp} λfp的奖励(实验中 λ f p = − 0.25 λ_{fp}=-0.25 λfp=−0.25);
假设我们以深度图(depth maps)的形式拥有真实的姿态和像素到像素的对应关系(就是ground truth);
-
正确匹配(correct):如果 p A , i p_{A,i} pA,i和 p B , j p_{B,j} pB,j都有深度,并且两个点位于他们各自重建的投影的ε像素内,奖励为正;
-
匹配的似是而非(plausible):如果 p A , i p_{A,i} pA,i和 p B , j p_{B,j} pB,j都没有深度,并且两点之间的极距(epipolar distance)小于ε像素,(奖励为0不奖励也不惩罚;
-
错误匹配(incorrect):其他情况,奖励为负(惩罚);
注:后面会对depth maps和epipolar distance进行消融实验;
3.4 梯度估计

对照最简单的梯度下降求导公式看
公式1除了特征匹配的质量好坏以外,没有对网络提供任何监督,这也意味呢,不参与匹配的点奖励为0(中性的)。这一点非常重要,因为(对应的)关键点不一定在两张图像中都有,只要它们之间没有创建不正确的匹配,就不应该受到惩罚(奖励函数不为负)。
另一方面,这可能会导致云上出现许多无法匹配的特征和类似的非显著结构,这些特征不太可能对下游任务有帮助,反而增加了特征匹配的复杂性。本文通过对每个采样的关键点施加额外的小惩罚 λ k p λ_{kp} λkp(实验中 λ k p = − 0.001 λ_{kp}=-0.001 λkp=−0.001)来解决这个问题,它可以被认为是一种正则化。
3.5 推理
模型训练结束后,在推理阶段,用标准的周期一致性检验代替概率模型框架,在验证集上采用比率检验(在3.2中提过的方法)。另一方面,本文的方法被限制在图2所示的网格中。这有两个缺点:
- 一个网格只能采样一个特征;
- 网格之间没有联系(网格对邻近的网格都是未知的);
解决方法:
可以选择两个相邻的像素作为不同的关键点,在推理时,我们可以通过在特征图K上应用非极大值抑制来解决这个问题,返回所有局部极大值处的特征。(训练和推理的不一致,可能会产生次优解,在4.4中进一步讨论)。
4 实验
训练集:MegaDepth数据集的一个子集,135个场景,63k图像;
特征提取网络:U-Net的一个变种,
优化:
- 可学习的参数 θ M θ_M θM;
- 选择 h = 8 h = 8 h=8(网格的大小);
- 对输入图像进行了缩放,填充/缩放成768 × 768;
- λ t p = 1 , λ f p = − 0.25 , λ k p = − 0.001 λ_{tp} = 1, λ_{fp} =−0.25,λ_{kp} =−0.001 λtp=1,λfp=−0.25,λkp=−0.001;
- Adam,lr= 1 0 − 4 10^{-4} 10−4;
- 评价:在10°误差范围之内计算mAA(mean Average Accuracy),记为 m A A ( 10 ° ) mAA(10°) mAA(10°);
4.1 2020图像匹配挑战赛(数据集)
具体结果见表1;

表1的信息量:
两个比赛:
- 1.一张图像有2k个特征的比赛(up to 2048 features/image);
- 2.一张图像有8k个特征的比赛(up to 8000 features/image);
两个比赛各有两种任务:
- stereo任务;
- multiview任务;
两种任务各自的评价指标:
- stereo任务:
- NM:the number of matches;
- NI:the number of RANSAC inliers;
- mAA: mean Average Accuracy;
- multiview任务:
- NM:the number of matches;
- NL:number of landmarks (3D points);
- TL:track length;
- mAA:mead Average Accuracy;
上半部分是DoG w/ Upright HardNet descriptors方法;
下半部分是本文的DISK方法;
正确的:绿色线-黄色线;
不正确:红色线;
无ground truth:蓝色线;
DISK可以匹配更多的点,并产生更准确的位姿。
DISK可以处理大尺度的变化(第4列和第5列),但不能处理旋转的大变化(第6列);
后有补充实验证明通过数据增强来补救图3所示的故障模式(指旋转角度大的情况)。

上半部分是DoG w/ Upright HardNet descriptors方法;
下半部分是本文的DISK方法;
蓝色:landmarks关键点;
红色:非landmarks关键点;
DISK可以生成更多的landmarks关键点;
4.2 HPatches的评估
HPatches数据集包含116个场景,每个场景6张图片。

viewpoint:图像只有视点变换;
illumination:图像只有光照变换;
both:既有视点变换又有光照变换;
左图:不同方法在不同偏差阈值下的准确性,DISK高于其他;
右图:不同方法的提取特征数量、匹配数量、AUC对比;
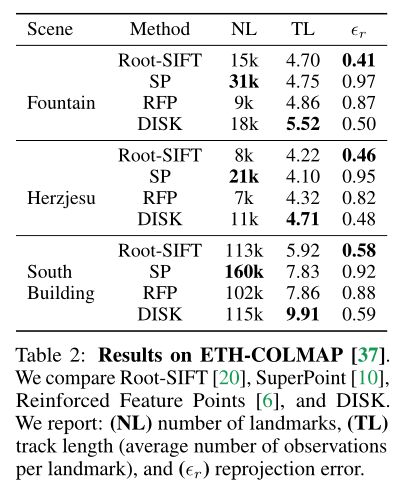
4.3 ETH-COLMAP上的评估

Fountain/Herzjesu/South Building:三个数据集,三个比较典型的图像;
对比方法:Root-SIFT/SP(SuperPoint)/RFP(Reinforced Feature Points)和DISK;
4.4 消融实验
4.4.1 Supervision without depth
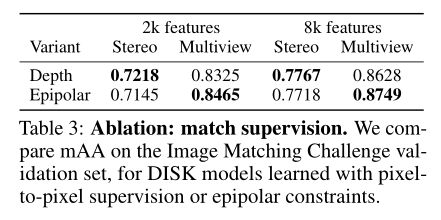
对depth maps(指用pixel-to-pixel来监督)和epipolar进行消融实验(如3.3节提到的),结果如表3所示;
stereo:指立体匹配(3D匹配);
multiview:多视图匹配,同一物体在同一场景不同视角下的图像配准;
mAA:mean Average Accuracy;

从表3中可以看出,对于epipolar约束来说,multiview的性能提高了,stereo的性能下降了;
4.4.2 nms 和 grid size


5 代码详情
5.0 运行流程
# 1.首先根据requirements.txt按照依赖包
# /subclones下的三个包可能克隆不下来需要手动点击下载
pip install -r requirements.txt


# 2. 用训练好的模型提取特征
# 给出保存h5的路径和输入图像路径
python detect.py h5_save_root img_root

# 3. 用提取的特征进行匹配
python match.py h5_save_root
# h5_save_root就是detect.py生成的结果路径
# 包含descriptors.h5和keypoints.h5
# 这一步生成matches.h5

# 4. 可视化结果
# 给出matches.h5的路径和匹配结果保存路径
# 查看关键点
python view_h5.py h5_save_root save_root keypoints
# 查看匹配
python view_h5.py h5_save_root save_root matchses
5.1 DISK框架
/disk/model/disk.py
class DISK(torch.nn.Module):
    def __init__(
        self,
        desc_dim=128,
        window=8,
        setup=DEFAULT_SETUP,
        kernel_size=5,
    ):
        super(DISK, self).__init__()

        # desc_dim = N = 128
        self.desc_dim = desc_dim
        self.unet = Unet(
            in_features=3, size=kernel_size,
            down=[16, 32, 64, 64, 64],
            up=[64, 64, 64, desc_dim+1],
            setup=setup,
        )
        self.detector = Detector(window=window)

    @dimchecked
    def _split(self, unet_output: ['B', 'C', 'H', 'W']) \
                -> (['B', 'C-1', 'H', 'W'], ['B', 1, 'H', 'W']):
        '''
        Splits the raw Unet output into descriptors and detection heatmap.
        '''
        assert unet_output.shape[1] == self.desc_dim + 1
        # 前128维 N
        descriptors = unet_output[:, :self.desc_dim]
        # 最后一维 K
        heatmap     = unet_output[:, self.desc_dim:]

        return descriptors, heatmap

    @dimchecked
    def features(
        self,
        images: ['B', 'C', 'H', 'W'],
        kind='rng',
        **kwargs
    ) -> NpArray[Features]:
        ''' allowed values for `kind`:
            * rng
            * nms
        '''

        B = images.shape[0]
        try:
            # 从U-Net结果中获取两个特征
            descriptors, heatmaps = self._split(self.unet(images))
        except RuntimeError as e:
            if 'Trying to downsample' in str(e):
                msg = ('U-Net failed because the input is of wrong shape. With '
                       'a n-step U-Net (n == 4 by default), input images have '
                       'to have height and width as multiples of 2^n (16 by '
                       'default).')
                raise RuntimeError(msg) from e
            else:
                raise

        keypoints = {
            # Grid-based sampling
            'rng': self.detector.sample,
            # Non-Maxima Suppression
            'nms': self.detector.nms,
        }[kind](heatmaps, **kwargs)

        # 关键点与描述符组合后
        # 返回结果
        # 在后面的代码会从features中解析出关键点/描述符/得分
        features = []
        for i in range(B):
            features.append(keypoints[i].merge_with_descriptors(descriptors[i]))

        return np.array(features, dtype=object)
5.2 特征分布代码
步骤1:对heatmap的裁剪代码
/disk/model/detector.py
    def _tile(self, heatmap: ['B', 'C', 'H', 'W']) -> ['B', 'C', 'h', 'w', 'T']:
        '''
        Divides the heatmap `heatmap` into tiles of size (v, v) where
        v==self.window. The tiles are flattened, resulting in the last
        dimension of the output T == v * v.
        '''
        v = self.window
        b, c, h, w = heatmap.shape

        assert heatmap.shape[2] % v == 0
        assert heatmap.shape[3] % v == 0

        return heatmap.unfold(2, v, v) \
                      .unfold(3, v, v) \
                      .reshape(b, c, h // v, w // v, v*v)
步骤2:训练时计算特征分布代码
/disk/model/detector.py
def point_distribution(
    logits: [..., 'T']
) -> ([...], [...], [...]):
    '''
    Implements the categorical proposal -> Bernoulli acceptance sampling
    scheme. Given a tensor of logits, performs samples on the last dimension,
    returning
        a) the proposals
        b) a binary mask indicating which ones were accepted
        c) the logp-probability of (proposal and acceptance decision)
    '''
    # logits: 传入的切割后的heatmap
    # 输入图像 (86*8,90*8)
    # logits: torch.Size([1, 86, 90, 64])
    # proposals: torch.Size([1, 86, 90])
    # proposal_logp: torch.Size([1, 86, 90])
    # accept_logits: torch.Size([1, 86, 90])

    # Categorical: 创建以参数logits为标准的类别分布
    proposal_dist = Categorical(logits=logits)
    # .sample: 生成指定维度的样本
    proposals     = proposal_dist.sample()
    # .log_prb: 所选择类别的对数概率
    proposal_logp = proposal_dist.log_prob(proposals)

    # select_on_last: 每个格子选取一个特征
    accept_logits = select_on_last(logits, proposals).squeeze(-1)

    accept_dist    = Bernoulli(logits=accept_logits)
    accept_samples = accept_dist.sample()
    accept_logp    = accept_dist.log_prob(accept_samples)
    # accept_mask: torch.Size([1, 86, 90])
    accept_mask    = accept_samples == 1.

    logp = proposal_logp + accept_logp

    return proposals, accept_mask, logp
步骤3:描述符与位置特征联系起来
/disk/model/detector.py
class Keypoints:
    '''
    A simple, temporary struct used to store keypoint detections and their
    log-probabilities. After construction, merge_with_descriptors is used to
    select corresponding descriptors from unet output.
    '''

    @dimchecked
    def __init__(self, xys: ['N', 2], logp: ['N']):
        self.xys  = xys
        self.logp = logp

    @dimchecked
    def merge_with_descriptors(self, descriptors: ['C', 'H', 'W']) -> Features:
        '''
        Select descriptors from a dense `descriptors` tensor, at locations
        given by `self.xys`
        '''
        x, y = self.xys.T

        desc = descriptors[:, y, x].T
        # l_2范数
        desc = F.normalize(desc, dim=-1)

        return Features(self.xys.to(torch.float32), desc, self.logp)
训练时整体流程代码
/disk/model/detector.py
    def sample(self, heatmap: ['B', 1, 'H', 'W']) -> NpArray[Keypoints]:
        '''
            Implements the training-time grid-based sampling protocol
        '''
        v = self.window
        dev = heatmap.device
        B, _, H, W = heatmap.shape

        assert H % v == 0
        assert W % v == 0

        # tile the heatmap into [window x window] tiles and pass it to
        # the categorical distribution.

        # 比如
        # 输入图像大小为 688 * 720
        # heatmap: torch.Size([1, 1, 688, 720])
        # 裁剪成8*8的格子 每个格子大小为64
        # 688/8 = 86  720/8 = 90
        # heatmap_tiled torch.Size([1, 86, 90, 64])

        heatmap_tiled = self._tile(heatmap).squeeze(1)

        # 计算特征分布
        proposals, accept_mask, logp = point_distribution(heatmap_tiled)

        # create a grid of xy coordinates and tile it as well
        # 计算位置特征
        cgrid = torch.stack(torch.meshgrid(
            torch.arange(H, device=dev),
            torch.arange(W, device=dev),
        )[::-1], dim=0).unsqueeze(0)

        cgrid_tiled = self._tile(cgrid)

        # extract xy coordinates from cgrid according to indices sampled
        # before
        xys = select_on_last(
            self._tile(cgrid).repeat(B, 1, 1, 1, 1),
            # unsqueeze and repeat on the (xy) dimension to grab
            # both components from the grid
            proposals.unsqueeze(1).repeat(1, 2, 1, 1)
        ).permute(0, 2, 3, 1) # -> bhw2

        keypoints = []
        for i in range(B):
            mask = accept_mask[i]
            keypoints.append(Keypoints(
                xys[i][mask],
                logp[i][mask],
            ))
        # 这里返回的就是F_A,F_B
        return np.array(keypoints, dtype=object)
5.3 匹配代码
提取好特征后对特征进行关键点匹配
步骤1:计算矩阵矩阵d
def distance_matrix(fs1: ['N', 'F'], fs2: ['M', 'F']) -> ['N', 'M']:
    '''
    Assumes fs1 and fs2 are normalized!
    '''
    return SQRT_2 * (1. - fs1 @ fs2.T).clamp(min=1e-6).sqrt()
步骤2:计算ratio test
def _ratio_one_way(dist_m: ['N', 'M'], rt) -> [2, 'K']:
    val, ix = torch.topk(dist_m, k=2, dim=1, largest=False)
    ratio = val[:, 0] / val[:, 1]
    passed_test = ratio < rt
    ix2 = ix[passed_test, 0]

    return _binary_to_index(passed_test, ix2)
match.py 主函数
if __name__ == '__main__':
    dtype = torch.float16 if args.f16 else torch.float32

    # 打开detect.py的descriptors.h5和keypoints.h5
    # H5Store类:读取.h5的信息
    described_samples = H5Store(args.h5_path, dtype=dtype)

    # 保存路径
    # brute_match函数:逻辑控制函数 图像两两互相匹配
    with h5py.File(os.path.join(args.h5_path, 'matches.h5'), 'a') as hdf:
        brute_match(described_samples, hdf)
5.4 结果展示
匹配结果
关键点