opencv 车道 直线检测
对于比赛的简单地图没有较为复杂的物体线条可以使用opencv的线条检测来检测车道,通过计算线条的斜率以及在图片中的位置可以判断小车车身的位置
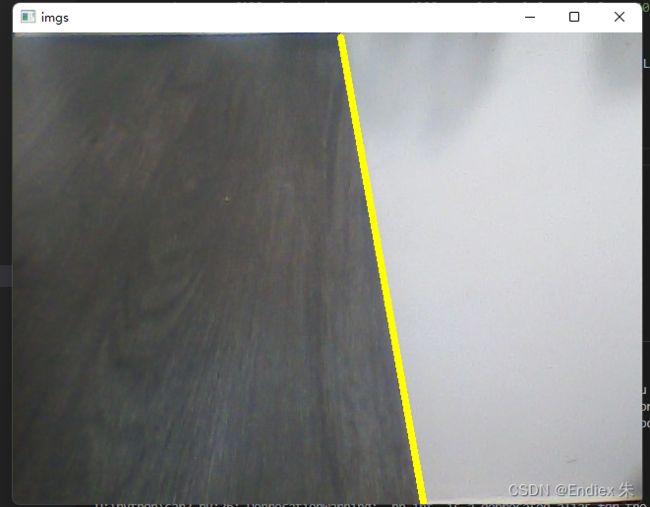
首先来看两条图片以及最终效果

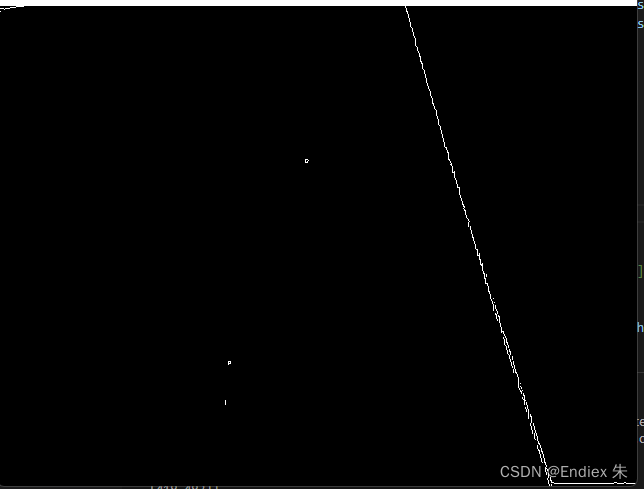
canny边缘检测得到图片中的所有线条
canny边缘检测是效果最好的一种 cv2.Canny(image, threshold1, threshold2, [, edges[, aper......]]) image: 图片对象 threshold:阈值1 threshold:阈值2
img = cv2.imread('./n1.jpg')
 gray = cv2.cvtColor(img,COLOR_RGB2GRAY)  #使用颜色空间将图片转换为灰度图
 imgs = cv2.Canny(gray, 100, 200)   #canny边缘检测
cv2.imshow一下得到如图
霍夫变换得到图中所有线条的列表
 lines = cv2.HoughLinesP(imgs, 1, np.pi/180, 15, minLineLength = 40, maxLineGap = 20)  #霍夫变换
 line = [line for line in lines]    #列表生成式得到所有的线条
离群值计算
因为霍夫变换得到的线段很多都是图中的噪点产生的对结果有很大的干扰性 使用离群值算法剔除这些噪点产生的值保留目标附近的线段
 def slop(lines):
     x1,y1,x2,y2 = lines[0]
     return (y2-y1)/(x2-x1)
 def outlier(line, threshold):
     slops = [slop(line) for line in lines]  #列表生成式的到所有线段的斜率
     while len(lines) > 0:
         mean = np.mean(slops) #得到线段中的主要值其实就是目标的斜率
         diff = [abs(s - mean) for s in slops]    #得到所有线段斜率与目标斜率的绝对值
         idx = np.argmax(diff)  #去除绝对值中的最大值的下标
         if diff(idx) > threshold:  #果最大绝对值大于给定的阈值则剔除
             slops.pop(idx)
             lines.pop(idx)
         else:
             break
     return lines
最小二乘拟合将线段拟合成一条线段
def fit(lines):
     x = np.ravel([[line[0][0],line[0][2]] for line in lines])
     y = np.ravel([[line[0][1],line[0][3]] for line in lines])
     poly = np.polyfit(x, y, deg=1)
     point_min = (np.min(x),np.polyval(poly, np.min(x)))
     point_max = (np.max(x),np.polyval(poly, np.max(x)))
     return np.array([point_min, point_max], dtype=np.int)
#返回值为拟合之后的一条线段由端点坐标组成的二维数组
所有代码
import cv2
 import numpy as np
 #计算斜率
 def slop(line):
     x1,y1,x2,y2 = line[0]
     return (y2-y1)/(x2-x1)
 #离群值计算
 def outlier(lines, threshold):
     slops = [slop(line) for line in lines]
     while len(lines) > 0:
         mean = np.mean(slops)
         diff = [abs(s - mean) for s in slops]
         idx = np.argmax(diff)
         if diff[idx] > threshold:
             slops.pop(idx)
             lines.pop(idx)
         else:
             break
     return lines
 def fit(lines):
     x = np.ravel([[line[0][0],line[0][2]] for line in lines])
     y = np.ravel([[line[0][1],line[0][3]] for line in lines])
     poly = np.polyfit(x, y, deg=1)
     point_min = (np.min(x),np.polyval(poly, np.min(x)))
     point_max = (np.max(x),np.polyval(poly, np.max(x)))
     return np.array([point_min, point_max], dtype=np.int)
 img = cv2.imread('./n2.jpg')  #读取图片
 gray = cv2.cvtColor(img, cv2.COLOR_RGB2GRAY)
 #canny边缘检测
 imgs = cv2.Canny(gray, 100, 200)
 cv2.imshow('imgs',imgs)
 cv2.waitKey(0)
 #图像分割
 #mask = np.zeros_like(imgs)
 #mask = cv2.fillPoly(mask, np.array([[[0,400],[0,0],[640,0],[640,400]]]),color = 255)
 #edges = cv2.bitwise_and(imgs, mask)
 #霍夫变换
 lines = cv2.HoughLinesP(imgs, 1, np.pi/180,15,minLineLength=40,maxLineGap=20)
 Lines = [line for line in lines]
 #离群值计算
 lines = outlier(Lines, 0.2)
 #最小二乘拟合
 Line = fit(lines)
 print(Line)
 cv2.line(img, tuple(Line[1]), tuple(Line[0]), color=(0, 255, 255), thickness=5)
 cv2.imshow('imgs',img)
 cv2.waitKey(0)
 cv2.destroyAllWindows()
对于视频流的操作
 from types import NoneType
 import cv2
 import numpy as np
 def slop(line):
     x1,y1,x2,y2 = line[0]
     return (y2-y1)/(x2-x1)
 def outlier(lines, threshold):
     slops = [slop(line) for line in lines]
     while len(lines) > 0:
         mean = np.mean(slops)
         diff = [abs(s - mean) for s in slops]
         idx = np.argmax(diff)
         if diff[idx] > threshold:
             slops.pop(idx)
             lines.pop(idx)
         else:
             break
     return lines
 def fit(lines):
     x = np.ravel([[line[0][0],line[0][2]] for line in lines])
     y = np.ravel([[line[0][1],line[0][3]] for line in lines])
     poly = np.polyfit(x, y, deg=1)
     point_min = (np.min(x),np.polyval(poly, np.min(x)))
     point_max = (np.max(x),np.polyval(poly, np.max(x)))
     return np.array([point_min, point_max], dtype=np.int32)
 cat = cv2.VideoCapture(0)
 cv2.namedWindow('img',cv2.WINDOW_NORMAL)
 cv2.resizeWindow('img',640,480)
 while True:
     ret, frame = cat.read()
     if not ret:
         break
     gray = cv2.cvtColor(frame,cv2.COLOR_RGB2GRAY)
     imgs = cv2.Canny(gray, 100, 200)
     lines = cv2.HoughLinesP(imgs, 1, np.pi/180,15,minLineLength=40,maxLineGap=20)
     if lines is None:
         continue
     Lines = [line for line in lines]
     lines = outlier(Lines, 0.2)
     Line = fit(lines)
     cv2.line(frame, tuple(Line[1]), tuple(Line[0]), color=(0, 255, 255), thickness=5)
     cv2.imshow('img',frame)
     if cv2.waitKey(10) == ord('q'):
         break
 cv2.destroyAllWindows()
对于检测车道上的多条线段可以通过线段的斜率以及相对位置区分各个不同的线段分别计算画出: