使用lstm交通流预测
import numpy as np
import pandas as pd
import matplotlib.pyplot as plt
import seaborn as sns
from sklearn.preprocessing import MinMaxScaler
from sklearn.metrics import r2_score
import tensorflow as tf
from tensorflow.keras import Sequential, utils, layers
import warnings

warnings.filterwarnings('ignore')
dataset = pd.read_csv(r"deepneuralnetwork-main\dataset\volume-005es18017-I-2015.csv")

dataset['stamp'] = pd.to_datetime(dataset['stamp'], format="%Y-%m-%d %H:%M:%S")

dataset.index = dataset.stamp
dataset.drop(columns=['stamp'], axis=1, inplace=True)

# 归一化
scaler = MinMaxScaler()
dataset['18017'] = scaler.fit_transform(dataset['18017'].values.reshape(-1, 1))


dataset['18017'].plot()
plt.show()

# 特征工程
def creat_new_dataset(dataset, seq_len=12):
    x = []  # 数据集
    y = []  # 标签
    start = 0
    end = dataset.shape[0] - seq_len
    for i in range(start, end):
        sample = dataset[i:i + seq_len]
        label = dataset[i + seq_len]
        x.append(sample)
        y.append(label)
    return np.array(x), np.array(y)


def split_dataset(x, y, train_ratio=0.8):
    x_len = len(x)
    train_data_len = int(x_len * train_ratio)
    x_train = x[:train_data_len]
    y_train = y[:train_data_len]

    x_test = x[train_data_len:]
    y_test = y[train_data_len:]

    return x_train, x_test, y_train, y_test


def create_batch_data(x, y, batch_size=32, data_type=1):
    if data_type == 1:
        dataset = tf.data.Dataset.from_tensor_slices((tf.constant(x), tf.constant(y)))
        test_batch_data = dataset.batch(batch_size)
        return test_batch_data
    else:
        dataset = tf.data.Dataset.from_tensor_slices((tf.constant(x), tf.constant(y)))
        train_batch_data = dataset.cache().shuffle(1000).batch(batch_size)
        return train_batch_data


def predict_next(model, sample, epoch=20):
    temp1 = list(sample[:, 0])
    for i in range(epoch):
        sample = sample.reshape(1, SEQ_LEN, 1)
        pred = model.predict(sample)
        value = pred.tolist()[0][0]
        temp1.append(value)
        sample = np.array(temp1[i + 1: i + SEQ_LEN + 1])
    return temp1


dataset_original = dataset
SEQ_LEN = 20  # 序列长度
x, y = creat_new_dataset(dataset_original.values, seq_len=SEQ_LEN)
x_train, x_test, y_train, y_test = split_dataset(x, y, train_ratio=0.9)
test_batch_dataset = create_batch_data(x_test, y_test, batch_size=256, data_type=1)
train_batch_dataset = create_batch_data(x_train, y_train, batch_size=256, data_type=2)

model = Sequential([layers.LSTM(8, input_shape=(SEQ_LEN, 1)), layers.Dense(1)])

file_path = r"model\best_checkpoint.hdf5"

checkpoint_callback = tf.keras.callbacks.ModelCheckpoint(filepath=file_path,
                                                         monitor='loss',
                                                         mode='min',
                                                         save_best_only=True,
                                                         save_weights_only=True)
model.compile(optimizer='adam', loss='mae')
history = model.fit(train_batch_dataset, epochs=10, validation_data=test_batch_dataset, callbacks=[checkpoint_callback])
plt.figure(figsize=(16, 8))
plt.plot(history.history['loss'], label="train loss")
plt.plot(history.history['val_loss'], label="val loss")
plt.title("LOSS")
plt.xlabel("Epochs")
plt.ylabel("Loss")
plt.legend(loc="best")
plt.show()

test_pred = model.predict(x_test, verbose=1)
score = r2_score(y_test, test_pred)
print(score)
plt.figure(figsize=(16, 8))
plt.plot(y_test, label="True label")
plt.plot(test_pred, label="Pred label")
plt.title("True vs Pred")
plt.legend(loc="best")
plt.show()

y_true = y_test[:100]
y_pred = test_pred[:100]
fig, axes = plt.subplots(2, 1, figsize=(16, 8))
axes[0].plot(y_true, marker='o', color='red')
axes[1].plot(y_pred, marker='*', color='blue')
plt.show()

# 模型测试
sample = x_test[-1]
sample = sample.reshape(1, sample.shape[0], 1)
sample_pred = model.predict(sample)

true_data = x_test[-1]
# print(list(true_data[:0]))
preds = predict_next(model, true_data, 20)

plt.figure(figsize=(12, 6))
plt.plot(preds, color="yellow", label="Prediction")
plt.plot(true_data, color="blue", label="Truth")
plt.xlabel("Epochs")
plt.ylabel("Value")
plt.legend(loc="best")
plt.show()
上述代码数据路径和生成的模型路径每个人的都不一样,按照自己的情况修改。数据集可以从以下这两个网址下载:
https://github.com/caailab/deepneuralnetwork
https://github.com/caailab/backtracking
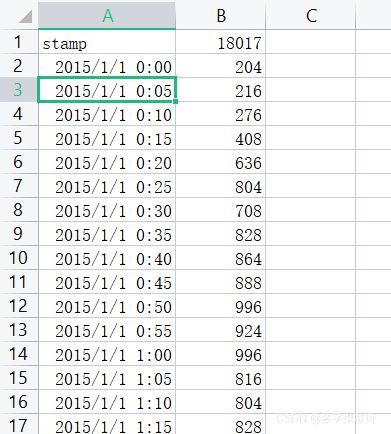
这个代码使用的数据集形式如下:
