聚类尝试-kmeans-step2聚类模型训练及结果可视化
step1:
https://blog.csdn.net/nikita_zj/article/details/122342746![]() https://blog.csdn.net/nikita_zj/article/details/122342746
https://blog.csdn.net/nikita_zj/article/details/122342746
1. 数据导入
import pandas as pd
import matplotlib.pyplot as plt
from sklearn import preprocessing
import pickle
import time
import multiprocessing
import seaborn as sns
plt.rcParams['font.sans-serif']=['SimHei']
plt.rcParams['axes.unicode_minus'] = False

df_shanghai = pd.read_csv('sh_ershou_clean_v2.csv', index_col = 0)

df_shanghai['year'] = df_shanghai['info'].str.extract('([\d]+)年').astype('float')
df_shanghai['age'] = 2022-df_shanghai.year

df_shanghai.drop(columns = ['longitude', 'dimension', 'year', 'latitude'], inplace = True)
2. 简单查看
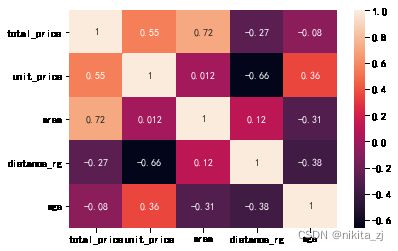
cor = df_shanghai[['total_price','unit_price', 'area', 'distance_rg', 'age']].corr()
sns.heatmap(cor, annot = True)
总体上来讲,建房时间越长,每平米价格越大(这块应该是因为建房时间长的总体上在比较市中心的地方),房屋面积越小,距离市中心越近。
3. 聚类模型训练
from sklearn.cluster import KMeans

def TrainCluster(df, model_name=None, start_k=2, end_k=10):
    print('training cluster')
    K = []
    SSE = []
    silhouette_all=[]
    models = [] #保存每次的模型
    for i in range(start_k, end_k):
        start = time.perf_counter ()
        kmeans_model = KMeans(n_clusters=i, random_state=42)
        kmeans_model.fit(df_shanghai_processed)
        SSE.append(kmeans_model.inertia_)  # 保存每一个k值的SSE值
        K.append(i)
        print('{}-prototypes SSE loss = {}'.format(i, kmeans_model.inertia_))
        models.append(kmeans_model) #保存每个k值对应的模型
        end = time.perf_counter ()
        print('Running time: %s Seconds'%(end-start))

    return(K,SSE,models)

K, SSE, models = TrainCluster(df = df_shanghai_processed)
4. 类别k值选择
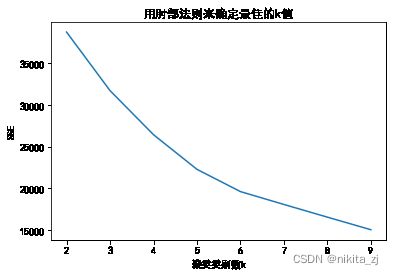
# 决定选择5
plt.plot(K, SSE)
plt.xlabel('聚类类别数k')
plt.ylabel('SSE')
plt.xticks(K)
plt.title('用肘部法则来确定最佳的k值')
plt.show()
5. 聚类结果可视化
#确定了最佳的k值后:5
best_model = models[K.index(5)]

df_shanghai['labels_'] = best_model.labels_

center = pd.DataFrame(best_model.cluster_centers_ )
center.columns = df_shanghai_processed.columns

# 添加原始值
for col in center.columns:
    col_new = col+'_raw'
    mean = df_shanghai[col].mean()
    std = df_shanghai[col].std()
    center[col_new] = center[col]*std+mean
    print(col_new)

center
每一簇的中心:
0 4466 地理位置也不太远、4-6万/平方、户型不太大、大多离人广10-25公里
1 2660 市中心大户型
2 2279 郊区大户型, 单价不是太高
3 159 面积有点太大了吧,简单看了下好多5室6室的房子
4 5216 市中心老破小
# 聚类后按类别对各个column绘制分布图
col = ['total_price',  'unit_price', 'area', 'distance_rg', 'age']
fig = plt.figure(figsize = (20,20))
n_col = len(col)
n_labels = 5
for i in range(n_col): #特征个数
    for j in range(n_labels): # 类别个数
        ax = fig.add_subplot(n_col, n_labels, n_labels*i+j+1)
        df_shanghai.loc[df_shanghai.labels_ == j, col[i]].plot(kind = 'hist', bins = 50)
        ax.set_title('label:{},col:{}'.format(j, col[i]))
#         if col[i] == 'unit_price':
#             ax.set_xlim(0, max(df_shanghai.unit_price))
#         if col[i] == 'area':
#             ax.set_xlim(0, max(df_shanghai.area))
#         if col[i] == 'distance_rg':
#             ax.set_xlim(0, max(df_shanghai.distance_rg))
#         if col[i] == 'age':
#             ax.set_xlim(0, max(df_shanghai.age))
plt.show()
# 绘制散点图
colors1 = '#00CED1' #点的颜色
colors2 = '#DC143C'
col1 = 'unit_price'
col2 = 'area'
for label in df_shanghai.labels_.unique():
# if label != 3:
if True:
x = df_shanghai.loc[df_shanghai.labels_ == label, col1]
y = df_shanghai.loc[df_shanghai.labels_ == label, col2]
plt.scatter(x, y, label = str(label), alpha = 0.3)
plt.legend()


