imblearn:随机过采样(过采样)
随机过采样的核心思想:
随机的复制、重复少数类样本,最终使得少数类与多数类的个数相同从而得到一个新的均衡的数据集。
最简单的过采样方法
imblearn:
from imblearn.over_sampling import RandomOverSampler实验:
1.第一步生成样本
from collections import Counter
from sklearn.datasets import make_classification
from matplotlib import pyplot as plt
# 生成一个样本个数是200,特征数目是2个,2分类,每个类的簇个数是1
# 两类生成的比例是0.06,:0.94 之和是1
# class_sep是代表类别之间的分散程度,越大越容易分类,如果等于40,簇之间间隔会非常远
X, y = make_classification(n_samples=100, n_features=2, n_informative=2,
                            n_redundant=0, n_repeated=0, n_classes=2,
                            n_clusters_per_class=1,
                            weights=[ 0.06, 0.94],
                            class_sep=0.8, random_state=0)

# 绘制原始数据集的图像
plt.scatter(X[:,0],X[:,1],c=y)
print(Counter(y))
plt.show()
结果:
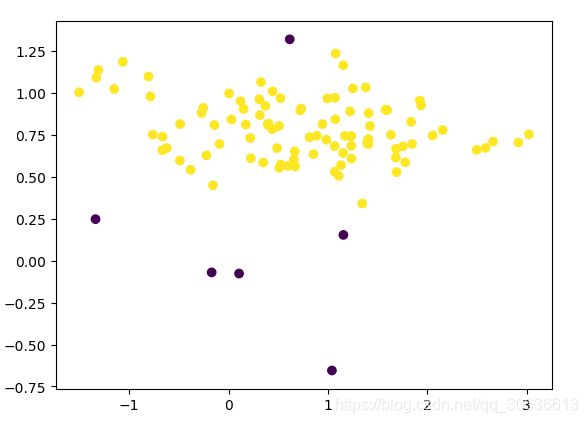
备注:生成了一个多数类个数是94,少数类是6的一个数据集。
2.第二步使用随机过采样方法重构数据集
from collections import Counter
from imblearn.over_sampling import RandomOverSampler as  ros

# 对原始数据集进行随机重采样
ros = ros(random_state=0)
X_resample,y_resample = ros.fit_resample(X,y)
# 绘制过采样后的曲线
plt.scatter(X_resample[:,0],X_resample[:,1],c=y_resample)
print(Counter(y_resample))
plt.show()
结果:
备注:
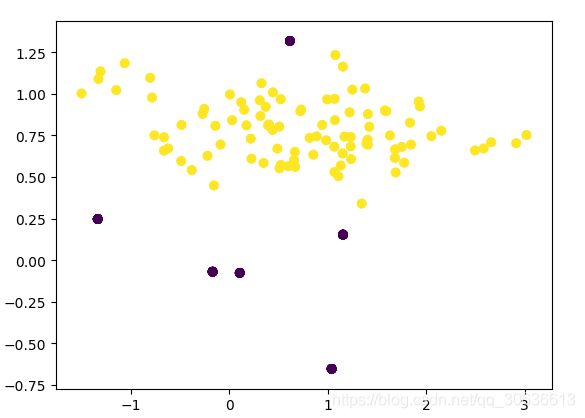
因为是简单的复制样本,所以过采样后的图形与原始图形一样
但是个数已经变成了94:94 ,即原本不均衡的样本变成了相同的数目,变成了一个均衡的数据集
3.第三步对原始数据及过采样之后的数据集的效果进行检测
#绘制决策边界函数

def plot_decision_function(X, y, clf, ax):
    plot_step = 0.02
    x_min, x_max = X[:, 0].min() - 1, X[:, 0].max() + 1
    y_min, y_max = X[:, 1].min() - 1, X[:, 1].max() + 1
    xx, yy = np.meshgrid(np.arange(x_min, x_max, plot_step),
                         np.arange(y_min, y_max, plot_step))

    Z = clf.predict(np.c_[xx.ravel(), yy.ravel()])
    Z = Z.reshape(xx.shape)
    ax.contourf(xx, yy, Z, alpha=0.4)
    ax.scatter(X[:, 0], X[:, 1], alpha=0.8, c=y, edgecolor='k')
#使用svm方法对数据集进行预测

from sklearn.svm import LinearSVC as svc

fig, (ax1, ax2) = plt.subplots(1, 2, figsize=(15, 12))
# 绘制原始数据集的决策边界
clf = svc().fit(X,y)
plot_decision_function(X,y,clf,ax1)
ros = ros(random_state=0)
X_resampled, y_resampled = ros.fit_resample(X, y)
#绘制过采样后的SVM的决策边界
clf = svc().fit(X_resampled,y_resampled)
sp.plot_decision_function(X_resampled,y_resampled,clf,ax2)
print(Counter(y_resampled))
fig.tight_layout()
plt.show()
结果:
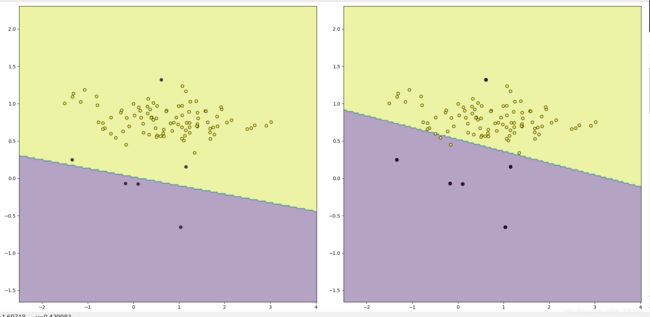
备注:左图就是未经过修改过的数据集的决策边界,右图就是经过重采样过后的决策边界,可以看到确实有一定的效果
完整代码
import numpy as np
from collections import Counter
from sklearn.datasets import make_classification
import matplotlib.pyplot as plt
from imblearn.over_sampling import RandomOverSampler as  ros
from sklearn.svm import LinearSVC as svc

#绘制决策边界函数

def plot_decision_function(X, y, clf, ax):
    plot_step = 0.02
    x_min, x_max = X[:, 0].min() - 1, X[:, 0].max() + 1
    y_min, y_max = X[:, 1].min() - 1, X[:, 1].max() + 1
    xx, yy = np.meshgrid(np.arange(x_min, x_max, plot_step),
                         np.arange(y_min, y_max, plot_step))

    Z = clf.predict(np.c_[xx.ravel(), yy.ravel()])
    Z = Z.reshape(xx.shape)
    ax.contourf(xx, yy, Z, alpha=0.4)
    ax.scatter(X[:, 0], X[:, 1], alpha=0.8, c=y, edgecolor='k')

X, y = make_classification(n_samples=100, n_features=2, n_informative=2,
                            n_redundant=0, n_repeated=0, n_classes=2,
                            n_clusters_per_class=1,
                            weights=[ 0.06, 0.94],
                            class_sep=0.8, random_state=0)
fig, (ax1, ax2) = plt.subplots(1, 2, figsize=(15, 12))
# 绘制原始曲线
# plt.scatter(X[:,0],X[:,1],c=y)
# 绘制原始数据集的决策边界
clf = svc().fit(X,y)
plot_decision_function(X,y,clf,ax1)
ros = ros(random_state=0)
X_resampled, y_resampled = ros.fit_resample(X, y)
# 绘制过采样后的曲线
# plt.scatter(X_resampled[:,0],X_resampled[:,1],c=y_resampled)
clf = svc().fit(X_resampled,y_resampled)
plot_decision_function(X_resampled,y_resampled,clf,ax2)
print(Counter(y_resampled))
print(len(X_resampled))
fig.tight_layout()
plt.show()


