2D人体姿态识别-Human3.6M与COCO数据集中,各人体骨骼关键点可视化及对应关节标注顺序(heatmap可视化,热力图和原图融合显示)
003-2.processData
文章目录
- 前言
- 一、最终结果展示
-
- 1. Human3.6M数据集中32个人体关键点可视化及含义
- 2. COCO数据集中19个人体关键点可视化及含义
- 3. Human3.6M和COCO两个数据集中共同的身体部位及其关键点
- 二、代码展示
-
- 1.Human 3.6M部分
-
- 1) 引入库
- 2)读入数据
- 3)可视化数据: Human3.6M中的2d关键点标注
-
- a.每张图片上标注一个关键点
- b.一张图片上标注所有关键点
- c.一张图片上标注共同的关键点
- 1.COCO部分
-
- 1) 引入库
- 2)读入数据
- 3)可视化heatmap
-
- a.每张图片上标注一个关键点
- b.一张图片上标注所有关键点
- c.一张图片上标注共同的关键点
前言
这篇文章里的案例使用的是Human3.6M数据集中S1人物的Sitting 1.55011271.mp4视频中的第13帧作为图片,分别将此帧在Human3.6M中的2D关节点标注和在COCO上训练过的Openpose检测出的Heatmap在这帧图片上进行可视化,并一一对照标出了Huamn3.6M中32个关键点和COCO数据集中19个关键点对应的身体部位,找出了在两个数据集中共同的身体部位及其关键点。
提示:以下是本篇文章正文内容,下面案例可供参考
一、最终结果展示
1. Human3.6M数据集中32个人体关键点可视化及含义
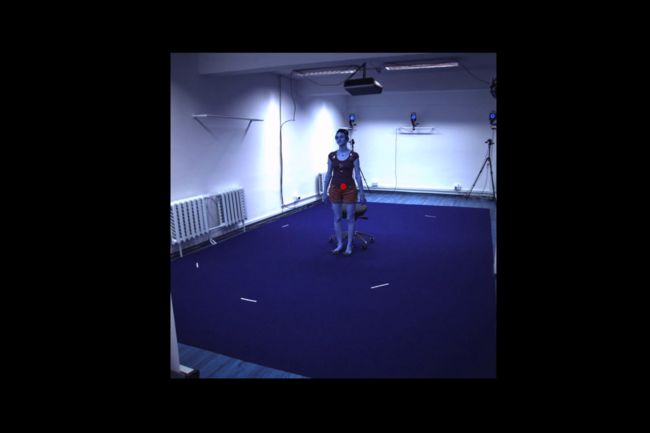
Human3.6M中的2D keypoints ground-truth可视化:
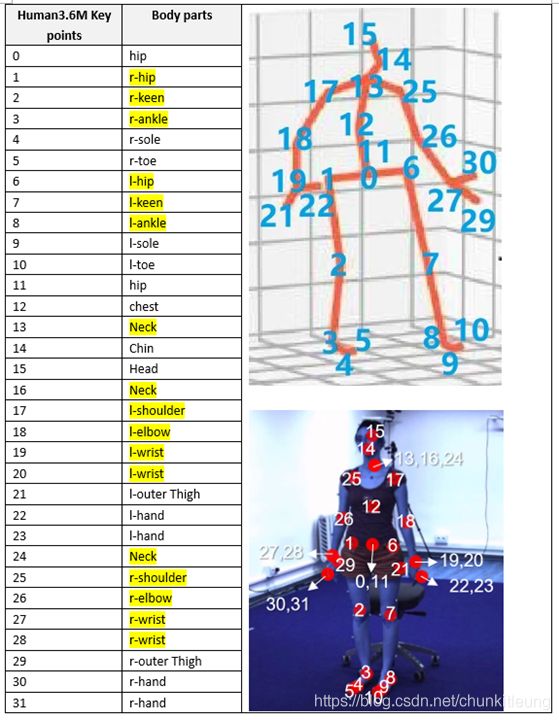
对比找到H36M中各关键点所对应的身体部位如下,黄色高光的部位表示H36M和COCO中共有的关键点:

其中右上图的骨架图来自于博文CSDN:human3.6m数据集格式解析中给出的部分关键点(keypoints),但这里的关键点并不完整。右下图和左表我整理出了完整的各关键点含义(注意有的身体部位被多个关键点重复标注了)。
2. COCO数据集中19个人体关键点可视化及含义
检测出的COCO keypoints heatmap可视化,取heatmap中置信度最高的点作为关节点标红:

对比找到COCO中各关键点所对应的身体部位如下,黄色高光的部位表示H36M和COCO中共有的关键点:
![]()
3. Human3.6M和COCO两个数据集中共同的身体部位及其关键点
![]()
二、代码展示
以下代码均在Jupyter notebook中运行
1.Human 3.6M部分
1) 引入库
- 在Jupyter中安装本地没有的package: (参考)直接在在Jupyter中安装Python第三方包
!pip install cdflib
import cdflib
import numpy as np
from matplotlib import pyplot as plt
import cv2 as cv
2)读入数据
代码如下(示例):
- Human3.6M数据集中cdf文件的构成+用cdflib库处理cdf文件 (参考)2D人体姿态识别-对Human3.6M数据集预处理(1):用python读取并处理cdf文件,cdflib包中各函数介绍,Human3.6M数据集2d关节点格式解读
#load a cdf file
cdf= cdflib.CDF('Sitting 1.55011271.cdf')

#Get the variables in the cdf file
x = cdf.varget("Pose")

#Get the keypoints and images at frame 13
x13 = x[:,14,:]
x13 = x13.reshape(32,2)
img = cv.imread('frames_Sitting 1.55011271.mp4_13.jpg')
3)可视化数据: Human3.6M中的2d关键点标注
a.每张图片上标注一个关键点
- 如何在循环中每次打印/保存不同的名字 (参考)python中占位符的使用
#Visualisation of each ground-truth keypoint
for i in range(0,32):
    plt.imshow(img,alpha=1)
    c_x,c_y = x13[i,:]
    plt.plot(c_x,c_y,'r.',alpha=0.6)
    plt.savefig("Sitting 1.55011271.mp4_f13_kp%d.png"%(i),dpi=300,bbox_inches='tight')
    plt.show()
文件夹中已保存图片如下:

举例,图片Sitting 1.55011271.mp4_f13_kp0.png如下::

这一步是为了能够对照图片和文件名观察出来,几号关键点对应的是哪个部位。
b.一张图片上标注所有关键点
#Visualisation of all ground-truth keypoints
plt.imshow(img,alpha=1)
for i in range(0,32):
    c_x,c_y = x13[i,:]
    plt.plot(c_x,c_y,'r.',alpha=0.6)
    #plt.annotate("%d"%(i), xy=(c_x,c_y),xytext=(5, 0), textcoords='offset points',color='w')

plt.savefig("Sitting 1.55011271.mp4_f13_32keypoints_noNumbers.png",dpi=300,bbox_inches='tight')
plt.show()
c.一张图片上标注共同的关键点
两个数据集都经过b.可视化步骤后,可以对比得出有哪些共同关键点,再进行这步。
#Visualisation of common ground-truth keypoints
plt.imshow(img,alpha=1)
H36M_Common_keypoints = [1,2,3,6,7,8,13,17,18,19,25,26,27]
for i in H36M_Common_keypoints:
    c_x,c_y = x13[i,:]
    plt.plot(c_x,c_y,'r.',alpha=0.6)

plt.savefig("Sitting 1.55011271.mp4_f13_CommonKeypoints.png",dpi=300,bbox_inches='tight')
plt.show()
1.COCO部分
1) 引入库
import numpy as np
from matplotlib import pyplot as plt
from PIL import Image
import cv2
2)读入数据
- 如何把numpy中的array提取成文件再在别的程序中使用 (参考)python-读取和保存npy文件
img_f13=np.array(Image.open('frames_Sitting 1.55011271.mp4_13.jpg'))
heatmaps_f13=np.load("frames_13.jpg.npy")
3)可视化heatmap
openpose生成的heatmap尺寸是128128,而图片的尺寸则是10001000。需要先把图片resize到与heatmap相同的尺寸,再进行叠加。
- 缩小原图到热力图的尺寸 (参考)opencv: 图像缩放(cv2.resize)
- 热力图和原图融合显示(参考)实现两幅图像的融合显示:Image.blend()、plt.imshow()、cv2.addWeighted()
- 加上heatmap中不同颜色对应的置信度 (参考)python matplotlib自定义colorbar颜色条-以及matplotlib中的内置色条
def BlendHeatmap(img,heatmaps,joint_num):
    '''data:original photo
    heatmaps: heatmap of all 19 joints(channels),Array shape(128,228,19)
    joint_num:heatmap of which joint(channel)to visualize'''

    h_heatmap,w_heatmap,d_heatmap=heatmaps.shape

    heatmap=heatmaps[:, :, joint_num]
    #resize
    scaled_img = cv2.resize(img, (w_heatmap, h_heatmap), interpolation=cv2.INTER_CUBIC)
    #blend resized image and heatmap
    plt.imshow(scaled_img,alpha=1)
    plt.imshow(heatmap,alpha=0.65)
    #add colorbar of the heatmap
    plt.colorbar(fraction=0.04,pad=0.03)
挑出热力图中置信度最大的点作为要描点的关节(贪婪算法)
def FindJoint(heatmaps,joint_num):
    heatmap=heatmaps[:, :, joint_num]
    max_possibility=np.max(heatmap)
    joint=np.argwhere(heatmap==max_possibility)
    joint=np.squeeze(joint)
    p_y=joint[0]
    p_x=joint[1]

    return p_x,p_y,max_possibility
a.每张图片上标注一个关键点
#Visualisation of each detected joints
for i in range(0,19):
    BlendHeatmap(img_f13,heatmaps_f13,i)
    x,y,c=FindJoint(heatmaps_f13,i)
    plt.plot(x,y,'r.',alpha=0.6)
    #plt.show()
    plt.savefig("Sitting 1_55011271_f13_j%d.png"%(i),dpi=300,bbox_inches='tight')
    plt.close()
举例,图片Sitting 1.55011271.mp4_f13_j0.png如下:
b.一张图片上标注所有关键点
#Visualisation of all detected joints
h_heatmap,w_heatmap,d_heatmap=heatmaps_f13.shape
scaled_img = cv2.resize(img_f13, (w_heatmap, h_heatmap), interpolation=cv2.INTER_CUBIC)
plt.imshow(scaled_img,alpha=1)
for i in range(0,19):
    heatmap=heatmaps_f13[:, :, i]
    plt.imshow(heatmap,alpha=0.05)
    x,y,c=FindJoint(heatmaps_f13,i)
    plt.plot(x,y,'r.',alpha=0.6)
plt.savefig("Sitting 1_55011271_f13_19joints.png",dpi=300,bbox_inches='tight')
c.一张图片上标注共同的关键点
#Visualisation of detected common joints
h_heatmap,w_heatmap,d_heatmap=heatmaps_f13.shape
scaled_img = cv2.resize(img_f13, (w_heatmap, h_heatmap), interpolation=cv2.INTER_CUBIC)
plt.imshow(scaled_img,alpha=1)
for i in range(1,14):
    heatmap=heatmaps_f13[:, :, i]
    plt.imshow(heatmap,alpha=0.05)
    x,y,c=FindJoint(heatmaps_f13,i)
    plt.plot(x,y,'r.',alpha=0.6)
plt.savefig("Sitting 1_55011271_f13_commonJoints.png",dpi=300,bbox_inches='tight')


