机器学习1——线性回归
线性回归
回归定义:
给出一个点集,构造一个函数来拟合这个点集,并且尽可能的让该点集与拟合函数间的误差最小,如果这个函数曲线是一条直线,那就被称为线性回归,如果曲线是一条三次曲线,则被称为三次多项式回归。回归的目的就是一个回归方程来预测目标值,整个回归的求解过程就是求这个回归方程的回归系数。
什么是线性回归?
线性回归线具有Y = a + bX形式的方程,其中X是解释变量,Y是因变量。直线的斜率为b,a是截距。
核心思想是获得一条最适合数据的线。最佳拟合线是总预测误差(所有数据点)尽可能小的那一条。误差是点到回归线的距离。
由于我们的数据不是完全分布在直线y = ax + b 上的,从而需要一个方法来评估每次产生的线的效果,然后去相应的调整来达到最好的效果。引入两个概念:
损失函数: 计算每个样本点的结果值和当前函数值的差值。具体使用的是 惨差平方和。
J ( θ 0 , θ 1 ) = 1 2 m ∑ i = 1 m ( h 0 ( x ( i ) ) − y ( i ) ) 2 J({\theta _0},{\theta _1}) = {1 \over {2m}}\sum\limits_{i = 1}^m {{{({h_0}({x^{(i)}}) - {y^{(i)}})}^2}} J(θ0,θ1)=2m1i=1∑m(h0(x(i))−y(i))2
最小二乘法: 通过损失函数来计算假设结果为直线y = ax + b 的情况下,得出损失值的大小。而最小二乘法就是要找一组a、b的值,使得损失值达到最小。
∑ i = 1 m ( h 0 ( x ( i ) ) − y ( i ) ) 2 \sum\limits_{i = 1}^m {{{({h_0}({x^{(i)}}) - {y^{(i)}})}^2}} i=1∑m(h0(x(i))−y(i))2
Python实现
1.LinearRegression的使用
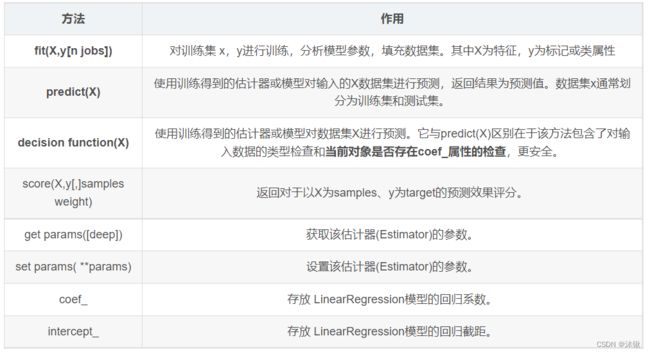
LinearRegression回归模型在Sklearn包中调用Sklearn.linear_model子类实现,主要是调用fit(x,y)函数来训练模型,其中x为数据的属性,y为所属类型。
LinearRegression(copy_X=True, fit_intercept=True, n_jobs=1, normalize=False)

copy_X:默认为True,是否对X复制,如果选择False,则直接对原始数据进行覆盖,即经过中心化、标准化后,把新数据覆盖到原数据上。
fit_intercept:,默认为True,是否对训练数据进行中心化,即是否计算此模型的截距,如果设置为 False,则不会在计算中使用截距。
n_jobs:计算时设置的任务个数。
normalize:默认为False,是否对数据进行标准化处理。官方给的建议是StandardScaler() 标准化数据,保证每个维度数据方差为1.均值为0。使得据测结果不会被某些维度过大的特征值而主导。
2.LinearRegression的方法
3.LinearRegression的使用
import pandas as pd
from sklearn import datasets
import numpy as np
from sklearn import linear_model
import matplotlib.pyplot as plt
#读取数据文件
data=pd.read_csv("弹性模量与压力.csv",encoding='ISO-8859-1', sep=',')
#提取自变量和因变量
X=data['N'].values.reshape(-1,1)
y=data['T'].values
#分割训练集和测试集,将80%的数据保留在训练数据集中,剩余保留在测试数据集中
from sklearn.model_selection import train_test_split
X_train, X_test, y_train, y_test = train_test_split(X, y, train_size=0.8, test_size=0.2, random_state=100)
#可视化
plt.scatter(X_train, y_train, color='purple')
plt.xlabel('X ')
plt.ylabel('y ')
plt.title("Scatter Plot")
plt.show()
#建立模型
from sklearn.linear_model import LinearRegression
lr = LinearRegression()
#训练模型并用模型进行预测
lr.fit(X_train, y_train)
y_predict = lr.predict(X_test) # 预测
#评估模型
print(f'训练精确度Training accuracy: {round(lr.score(X_train, y_train)*100, 2)}%')
print(f'测试精确度Training accuracy: {round(lr.score(X_test, y_test)*100, 2)}%')
如果大家缺少数据集,也可以使用Sklearn学习包内置的糖尿病数据集
from sklearn import datasets
import numpy as np
from sklearn import linear_model
import matplotlib.pyplot as plt

# 第一步 数据集划分
d = datasets.load_diabetes()  # 数据 10*442
x = d.data
x_one = x[:, np.newaxis, 2]  # 获取一个特征 第3列数据
y = d.target  # 获取的正确结果
x_train = x_one[:-42]  # 训练集X [  0:400]
x_test = x_one[-42:]  # 预测集X [401:442]
y_train = y[:-42]  # 训练集Y [  0:400]
y_test = y[-42:]  # 预测集Y [401:442]

# 第二步 线性回归实现
clf = linear_model.LinearRegression()
# print(clf)                   # 回归模型
clf.fit(x_train, y_train)  # 对训练集X和训练集Y进行训练
pre = clf.predict(x_test)  # 预测值
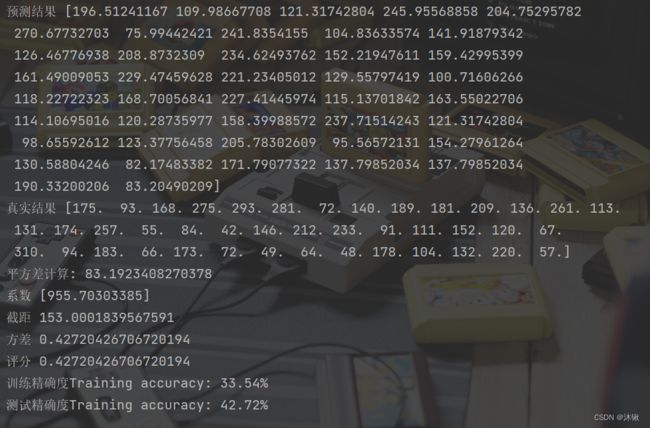
print('预测结果', pre)
print('真实结果', y_test)

# 第三步 评价结果
cost = np.mean(y_test - pre) ** 2  # 平方差之和
print('平方差计算:', cost)
print('系数', clf.coef_)
print('截距', clf.intercept_)
print('方差', clf.score(x_test, y_test))
print('评分',clf.score(x_test, y_test))
print(f'训练精确度Training accuracy: {round(clf.score(x_train, y_train)*100, 2)}%')
print(f'测试精确度Training accuracy: {round(clf.score(x_test, y_test)*100, 2)}%')

# 第四步 绘图
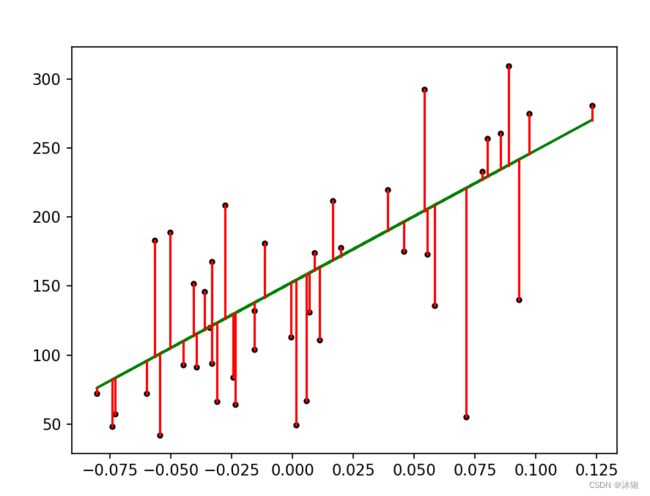
plt.plot(x_test, y_test, 'k.')  # 散点图
plt.plot(x_test, pre, 'g-')  # 预测回归直线
# 绘制点到直线距离
for idx, m in enumerate(x_test):
    plt.plot([m, m], [y_test[idx], pre[idx]], 'r-')

# plt.savefig('blog12-01.png', dpi=300) # 保存图片
plt.show()
线性回归优缺点
优点:可解释性强,简单
缺点:预测精确度低,不相关的特征会影响结果,只适用于线性数据,使用时需要先对数据进行判断


