(单细胞-SingleCell)Seurat流程文献复现——单细胞实战分析流程
单细胞项目:来自于30个病人的49个组织样品,跨越3个治疗阶段
Therapy-Induced Evolution of Human Lung Cancer Revealed by Single-Cell RNA Sequencing
这篇教程我将分为四个阶段完整的阐述单细胞的主流的下游分析流程
- 数据预处理(数据准备阶段)
- seurat 基础分析
- 免疫细胞识别
- inferCNV 的实现
先来第一部分数据预处理
这里的数据预处理很自由,其中一部分是必须按照严格的标准进行比如计算外源基因,线粒体, 核糖体等等
# 导入包
library(Seurat)
library(dplyr)
library(Matrix)
library(magrittr)
library(stringr)
library(tidyverse)
options(stringsAsFactors = F)
options(as.is = T)
setwd('/Users/yuansh/Desktop/单细胞/scell_lung_adenocarcinoma-master')
文章的话一共是有 2 个表达矩阵需要处理
我们这里的话要很明确的知道表达谱的预处理到底预处理什么东西
- 看一下 count 矩阵是否是 hista 比对结果,如果是需要剔除 hista 比对的注释信息。(有的也是已经处理完了,但是也得检查)
- 确定一下 cell 名的组成,构建好 metadata(行名) 和 count(列名) 矩阵能够对应
- 过滤掉外源 RNA (ERCC)
- 合并成为 seurat 对象
- 计算线粒体(MT),核糖体的 RNA(^RP[SL]) 比例并筛选数据
我们先处理第一个表达矩阵
# 这个是治疗前的第一个表达矩阵
# 导入数据
raw.data = read.csv('csv_files/S01_datafinal.csv', header=T, row.names = 1)
metadata = read.csv("csv_files/S01_metacells.csv", row.names=1, header=T)
dim(raw.data)
dim(metadata)
判断一下是否是 hista 比对的结果并且没有处理,如果是的话后面 5 行是没用的
然后我们发现并不是
继续观察发现,raw.data 是 count 矩阵,metadata 是信息矩阵
count 矩阵的列名是 meta 矩阵的 well 和 plate 合并的
稍微对数据进行处理一下,然后保存,确保 count 矩阵的列名和 metadata 的行名一样
这样的话下次读取就很快
> tail(raw.data[,1:4])
A10_1001000329 A10_1001000362 A10_1001000366 A10_1001000367
ZXDC                0              0              0              0
ZYG11A              0              0              0              0
ZYG11B              0              0              0              0
ZYX               292              0              0              0
ZZEF1              66              0              0              0
ZZZ3                0              0              0              0

> raw.data[1:4,1:4]
A10_1001000329 A10_1001000362 A10_1001000366 A10_1001000367
A1BG                  3              0              0              0
A1BG-AS1              0              0              0              0
A1CF                  0              0              0              0
A2M                  68              0              0              0

> metadata[1:4,1:4]
well      plate        cell_id sample_name
1  A10 1001000329 A10_1001000329      LT_S07
2  A10 1001000362 A10_1001000362      LT_S12
3  A10 1001000366 A10_1001000366      LT_S13
4  A10 1001000367 A10_1001000367      LT_S13
paste0(metadata$well[1],'_',metadata$plate[1]) # 在进行大幅度修改的时候要判断代码有没有写错
colnames(raw.data)[1]
# 修改一下 metadata 的行名
rownames(metadata) = paste0(metadata$well,'_',metadata$plate)
# 确定了行名metadata 的行名和 count 矩阵 raw.data 的列名相等
identical(colnames(raw.data),rownames(metadata))
接下来就是基因的处理,
按照上面说的步骤:
- 剔除外源基因,然后构建 seurat 对象
- 计算线粒体基因(有没有都算就行了)
- 计算核糖体基因
# 这里要过滤 ERCC(External RNA Control Consortium)
# ERCC 是外源 RNA 主要的作用就是用来质控的
erccs = grep('^ERCC-', x= rownames(x=raw.data),value = T) # value = T 获取名字
# 计算 ercc 比例
percent.ercc = Matrix::colSums(raw.data[erccs, ])/Matrix::colSums(raw.data)
fivenum(percent.ercc)
ercc.index = grep(pattern = "^ERCC-", x = rownames(x = raw.data), value = FALSE) # 获取 index
# 删除 Count 矩阵中的 ERCC
raw.data = raw.data[-ercc.index,]
dim(raw.data)
# [1] 26485 27489
构建 seurat 对象
# 构建对象
# min.cells 某一个基因至少在多少个基因中表达
# min.features 某个细胞至少表达多少个基因
min.cells = 0 # 3 因为文章没有筛选,所以这里设为0
min.features = 0 # 150 # 同上
sce = CreateSeuratObject(counts = raw.data,metadata = metadata,min.cells =min.cells,min.features =min.features)
sce
我们先看一下 sce 对象中的 meta.data,这个是构建 seurat 对象自动生成的,缺少了很多信息,所以要把 metdata 添加上去
> [email protected][1:5,1:5]
orig.ident nCount_RNA nFeature_RNA sample_name patient_id
A10_1001000329 SeuratProject     681122         2996      LT_S07      TH103
A10_1001000362 SeuratProject         30           17      LT_S12      TH172
A10_1001000366 SeuratProject         29           19      LT_S13      TH169
A10_1001000367 SeuratProject        286            3      LT_S13      TH169
A10_1001000372 SeuratProject        599          240      LT_S14      TH153
sce = AddMetaData(object = sce, metadata = metadata)
sce = AddMetaData(object = sce, percent.ercc, col.name = "percent.ercc")
# Head to check
head([email protected])
然后就是数据清洗
数据清洗原则:
- 不符合质量的:这里一般指细胞中基因数太少或者某些基因只在两三个细胞中表达
- 过滤线粒体 DNA占比过高的
- 过滤核糖体占比过高的
在过滤前先计算
table(grepl("^MT-",rownames(sce)))
table(grepl("^RP[SL][[:digit:]]",rownames(sce)))
sce[["percent.mt"]]  = PercentageFeatureSet(sce, pattern = "^MT-")
sce[["percent.rp"]]  = PercentageFeatureSet(sce, pattern = "^RP[SL][[:digit:]]")
dim(sce)
summary(sce[["nCount_RNA"]])
summary(sce[["nFeature_RNA"]])
summary(sce[["percent.mt"]]  )
summary(sce[["percent.ercc"]] )
summary(sce[["percent.rp"]]  )
文章中是啥都没去,就正常的过滤了一下基因和表达过低的细胞
# 过滤筛选
# 一般根据实际情况进行筛选,这次的筛选主要还是根据文章里面的流程
# 这个过滤蛮自由的,所以随便搞一下就行
myData1 = subset(x=sce, subset = nCount_RNA > 50000 & nFeature_RNA > 500)
myData1
save(myData1,file='myData1.Rdata')
第一阶段的处理流程就是这样
接着处理第二个表达矩阵
# 这个是治疗前的第一个表达矩阵
# 导入数据
raw.data = read.csv('Data_input/csv_files/neo-osi_rawdata.csv', header=T, row.names = 1)
metadata = read.csv("Data_input/csv_files/neo-osi_metadata.csv", row.names=1, header=T)
raw.data[1:4,1:4]
metadata[1:4,1:4]
判断一下是否是 hista 比对的结果并且没有处理,如果是的话后面 5 行是没用的
然后发现果然是
继续观察发现,第二套数据的命名规则和第一套有点不太一样,多了_S10.homo,因此要把他去掉
稍微对数据进行处理一下,然后保存,确保 count 矩阵的列名和 metadata 的行名一样
这样的话下次读取就很快
> tail(raw.data[,1:4])
A10_B000561_S10.homo A10_B000563_S10.homo A10_B000568_S10.homo A10_B001544_S10.homo
ZZZ3                                      0                    0                    0                    0
__no_feature                          31084                92098               131276              1197071
__ambiguous                             353                 2231                  570                21247
__too_low_aQual                           0                    0                    0                    0
__not_aligned                             0                    0                    0                    0
__alignment_not_unique                67598                44778                47959               500993
> raw.data[1:4,1:4]
A10_B000561_S10.homo A10_B000563_S10.homo A10_B000568_S10.homo A10_B001544_S10.homo
A1BG                        0                    0                    0                    0
A1BG-AS1                    0                    0                    0                    0
A1CF                        0                    0                    0                    0
A2M                         0                    0                    0                    0
> metadata[1:4,1:4]
plate sample_name patient_id sample_type
1 B001567       AZ_01      AZ003       tumor
2 B001544       AZ_01      AZ003       tumor
3 B001546       AZ_01      AZ003       tumor
4 B001481       AZ_01      AZ003       tumor
然后我们进一步的发现,这套数据好像是没有 well 信息的
所以又要进一步处理一下,确保count 矩阵的列名和 metadata 矩阵的行名可以对应
gsub('_S[[:digit:]]*.homo','',colnames(raw.data))[1:5]
colnames(raw.data) = gsub('_S[[:digit:]]*.homo','',colnames(raw.data))
raw.data = raw.data[-grep('__',rownames(raw.data)),]
tail(raw.data[,1:4])
metadata$well[1] # 发现这套数据中的 metadata 中没有 well 信息
metadata$plate[1] # 好在有 plate信息
所以稍微进行处理一下
# 将 count 矩阵的名字拆开自己构建 well 信息矩阵
library(stringr)
wellInfo = str_split(colnames(raw.data),'_',simplify = T)%>% as.data.frame()
colnames(wellInfo) = c("well", "plate")
rownames(wellInfo) = paste0(wellInfo[,1],'_',wellInfo[,2])
# 修改一下 metadata 的行名
wellInfo[1:4,]
metadata = left_join(wellInfo, metadata, by = "plate")
metadata[1:4,]
wellInfo[1:4,]
rownames(metadata) = rownames(wellInfo)
# 判断一下是否一致
identical(colnames(raw.data),rownames(metadata))
> metadata[1:5,1:5]
well   plate sample_name patient_id sample_type
A10_B000561  A10 B000561       AZ_04  AZ008_NAT         NAT
A10_B000563  A10 B000563       AZ_04  AZ008_NAT         NAT
A10_B000568  A10 B000568       AZ_05      AZ008       tumor
A10_B001544  A10 B001544       AZ_01      AZ003       tumor
A10_B001546  A10 B001546       AZ_01      AZ003       tumor
接下来的步骤和上面完全一样
# ERCC 是外源 RNA 主要的作用就是用来质控的
erccs = grep('^ERCC-', x= rownames(x=raw.data),value = T) # value = T 获取名字
# 计算 ercc 比例
percent.ercc = Matrix::colSums(raw.data[erccs, ])/Matrix::colSums(raw.data)
fivenum(percent.ercc) # 查看前 5 个结果
ercc.index = grep(pattern = "^ERCC-", x = rownames(x = raw.data), value = FALSE) # 获取 index
# 删除 Count 矩阵中的 ERCC
raw.data = raw.data[-ercc.index,]
dim(raw.data)
# [1] 26485  3507
# 构建对象
# 构建对象
# min.cells 某一个基因至少在多少个基因中表达
# min.features 某个细胞至少表达多少个基因
min.cells = 0 # 3
min.features = 0 # 150 #
sce = CreateSeuratObject(counts = raw.data,metadata = metadata,min.cells =min.cells,min.features =min.features)
# 添加metadata 和 外源基因信息
sce = AddMetaData(object = sce,metadata = metadata)
sce = AddMetaData(object = sce, percent.ercc, col.name = "percent.ercc")
# 2.数据清洗
# 数据清洗原则
# 1. 不符合质量的
# 2. 过滤线粒体 DNA
# 3. 过滤外原DNA
# 在过滤前先计算
table(grepl("^MT-",rownames(sce)))
table(grepl("^RP[SL][[:digit:]]",rownames(sce)))
sce[["percent.mt"]]  = PercentageFeatureSet(sce, pattern = "^MT-")
sce[["percent.rp"]]  = PercentageFeatureSet(sce, pattern = "^RP[SL][[:digit:]]")
dim(sce)
summary(sce[["nCount_RNA"]])
summary(sce[["nFeature_RNA"]])
summary(sce[["percent.mt"]]  )
summary(sce[["percent.ercc"]] )
summary(sce[["percent.rp"]]  )

# 过滤筛选
# 一般根据实际情况进行筛选,这次的筛选主要还是根据文章里面的流程
myData2 = subset(x=sce, subset = nCount_RNA > 50000 & nFeature_RNA > 500)
myData2
# 26485 features across 2070 samples within 1 assay
save(myData2,file='myData2.Rdata')
第一部分结束,准备进入第二部分
第二部分 seurat 标准流程
小提琴图观察数据分布情况
rm(list = ls())
# 小提琴图可视化
load("myData1.Rdata")
load("myData2.Rdata")

allData = merge(x = myData1, y = myData2)
table([email protected]$sample_name) %>% length()
VlnPlot(allData, features = 'nFeature_RNA', group.by = 'sample_name')
接下来就是走流程
先观察一下数据的分布情况
rm(list = ls())
# 小提琴图可视化
load("allData.Rdata")
raw_sce = allData
rm(allData)
plot1 = FeatureScatter(raw_sce, feature1 = "nCount_RNA", feature2 = "percent.ercc")
plot2 = FeatureScatter(raw_sce, feature1 = "nCount_RNA", feature2 = "nFeature_RNA")
CombinePlots(plots = list(plot1, plot2))
[外链图片转存失败,源站可能有防盗链机制,建议将图片保存下来直接上传(img-bex3RwOY-1614138377387)(https://tva1.sinaimg.cn/large/0081Kckwly1gkir1ibb7cj31jm0lc43b.jpg)]
流程:
- log : NormalizeData
- 找特征 : FindVariableFeatures
- 标准化 : ScaleData
- pca : RunPCA
- 构建图 : FindNeighbors
- 聚类 : FindClusters
- tsne /umap : RunTSNE RunUMAP
- 差异基因 : FindAllMarkers / FindMarkers
VlnPlot(raw_sce, features = c("percent.rp", "percent.ercc"), ncol = 2)
# 开始走流程
# 1.log
sce = raw_sce
rm(raw_sce)
sce = NormalizeData(object = sce,normalization.method =  "LogNormalize",  scale.factor = 1e6)
# 2. 特征提取
sce = FindVariableFeatures(object = sce,selection.method = "vst", nfeatures = 2000)
# 所有特征
VariableFeatures(sce)
top20=head(VariableFeatures(sce),20)# 提取差异最大的 top20 基因
plot1= VariableFeaturePlot(sce)
plot2=LabelPoints(plot = plot1, points = top20, repel = TRUE)
plot2
# 3.标准化
sce = ScaleData(object = sce)
# 4. PCA
sce = RunPCA(object = sce, do.print = FALSE)
# 可视化
ElbowPlot(sce)
VizDimLoadings(sce, dims = 1:5, reduction = "pca", nfeatures = 10)
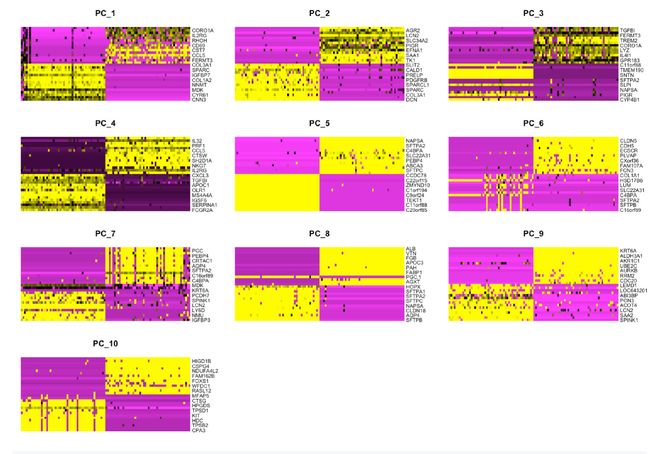
DimHeatmap(sce, dims = 1:10, cells = 100, balanced = TRUE)
[外链图片转存失败,源站可能有防盗链机制,建议将图片保存下来直接上传(img-MW8tmYr0-1614138377390)(https://tva1.sinaimg.cn/large/0081Kckwly1gkir227e5yj30u00z9dr5.jpg)]
# 5.构建图
#细胞聚类
#首先我们在PCA空间里根据欧氏距离构建一个KNN图,并在任意两个细胞间要确定它们的边缘权重,这个过程#用FindNeighbors函数,这里的input就是前面我们定义的dataset的维数。
# 选 20 个主成分
sce= FindNeighbors(sce, dims = 1:20)
# 6. 聚类
#再用FindClusters函数,该函数有一个“分辨率”的参数,该参数设置下游聚类的“粒度”,值
#越高,得到的聚类数越多。这个参数设置在0.4-1.2之间,
#对于3千个左右的单细胞数据通常会得到
#比较好的结果。对于较大的数据集,最佳分辨率通常会增加。
sce = FindClusters(sce, resolution = 0.5)
# 小剧场
# 不同的 resolution 分群的结果不一样
# 下面介绍两种可视化方法
# 首先先用两种不同的resolution 进行计算
sce = FindClusters(sce, resolution = 0.2)
sce = FindClusters(sce, resolution = 0.8)

library(gplots)
tab.1=table([email protected]$RNA_snn_res.0.2,[email protected]$RNA_snn_res.0.8)
# 这个是第一幅图
balloonplot(tab.1)

# Check clustering stability at given resolution
# Set different resolutions
res.used = c(0.2,0.8)
res.used
# Loop over and perform clustering of different resolutions
for(i in res.used){
  sce = FindClusters(object = sce, verbose = T, resolution = res.used)
}
# Make plot
library(clustree)
clustree(sce) +
  theme(legend.position = "bottom") +
  scale_color_brewer(palette = "Set1") +
  scale_edge_color_continuous(low = "grey80", high = "red")
# 把数据删除
[email protected] = [email protected][,-grep("snn_res.",ids,value = T)]
# 然后用文章给的 0.5
sce = FindClusters(sce, resolution = 0.5)
这两张图显示了不同的分辨率情况下的分类结果(这两张图要是看不懂就真的极其的过分)
[外链图片转存失败,源站可能有防盗链机制,建议将图片保存下来直接上传(img-07YIOHvF-1614138377392)(https://tva1.sinaimg.cn/large/0081Kckwly1gkir387hzrj316a0u07gs.jpg)]
resolution 等于0.2的时候分了 19 类,等于 0.8 的时候分成了 31 类
# 7.tsne
#Seurat提供了几种非线性的降维技术,如tSNE和UMAP。这些算法的目标是在低维空间中将相似的#细胞放在一起。上面所确定的基于图的集群中的单元应该在这些降维图上共同定位。作为
#UMAP和tSNE的input,我们建议使用与聚类分析的输入相同的PCs作为输入。
sce=RunTSNE(sce,dims.use = 1:20)  ##tsne降维
sce=RunUMAP(sce,dims = 1:20)  ##umap降维
##可视化
p1=DimPlot(sce, reduction = "tsne")
p1
p2=DimPlot(sce, reduction = "umap")
p2
CombinePlots(plots =list(p1, p2))
[外链图片转存失败,源站可能有防盗链机制,建议将图片保存下来直接上传(img-IHPqaumn-1614138377393)(https://tva1.sinaimg.cn/large/0081Kckwly1gkir3g66vjj31gi0u01kx.jpg)]
# 用 ggplot 可视化
phe=data.frame(cell=rownames([email protected]),
               cluster [email protected]$seurat_clusters)
head(phe)
table(phe$cluster)
tsne_pos=Embeddings(sce,'tsne')
head(phe)
table(phe$cluster)
head(tsne_pos)
dat=cbind(tsne_pos,phe)
library(ggplot2)
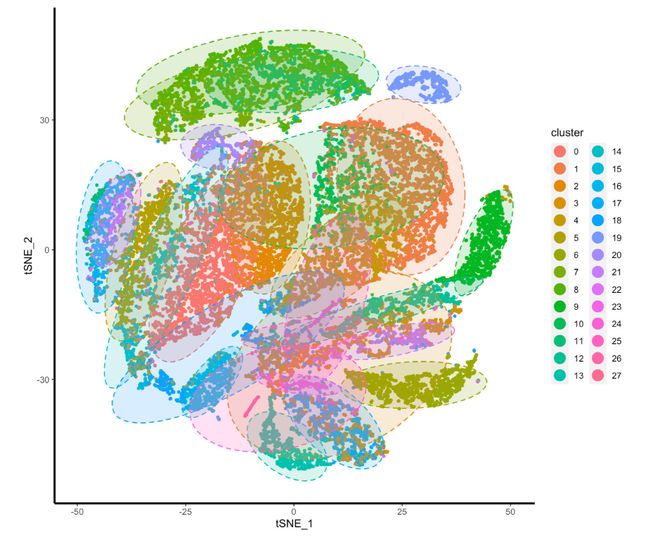
p=ggplot(dat,aes(x=tSNE_1,y=tSNE_2,color=cluster))+geom_point(size=0.95)
p=p+stat_ellipse(data=dat,aes(x=tSNE_1,y=tSNE_2,fill=cluster,color=cluster),
                 geom = "polygon",alpha=0.2,level=0.9,type="t",linetype = 2,show.legend = F)+coord_fixed()
print(p)
theme= theme(panel.grid =element_blank()) +   ## 删去网格
  theme(panel.border = element_blank(),panel.background = element_blank()) +   ## 删去外层边框
  theme(axis.line = element_line(size=1, colour = "black"))
p=p+theme+guides(colour = guide_legend(override.aes = list(size=5)))
print(p)
# umpa 也是一样的就不画了
# 8.差异基因
# 寻找某几个簇之间的差异基因
#cluster5.markers = FindMarkers(pbmc, ident.1 = 5, ident.2 = c(0, 3), min.pct = 0.25)
# 找全部的差异基因(要非常久)
sce.markers <- FindAllMarkers(object = sce, only.pos = TRUE, min.pct = 0.25,
                              thresh.use = 0.25)

DT::datatable(sce.markers)
write.csv(sce.markers,file=paste0(pro,'_sce.markers.csv'))
library(dplyr)
top10 <- sce.markers %>% group_by(cluster) %>% top_n(10, avg_logFC)
# 这个图要画太久,所以只选 15 个
DoHeatmap(sce,top10$gene[1:15],size=3)
ggsave(filename=paste0(pro,'_sce.markers_heatmap.pdf'))
sce.first=sce
save(sce.first,sce.markers,file = 'first_sce.Rdata')
rm(list=ls())
options(stringsAsFactors = F)
library(Seurat)
load(file = 'first_sce.Rdata')
sce = sce.first
rm(sce.first)

# 这个图要画非常就,所一就画一幅基于可以了
# 这个图是看合个组分之间的差异
for( i in 1 ){
  markers_df <- FindMarkers(object = sce, ident.1 = i, min.pct = 0.25)
  print(x = head(markers_df))
  markers_genes =  rownames(head(x = markers_df, n = 5))
  VlnPlot(object = sce, features =markers_genes,log =T )
  FeaturePlot(object = sce, features=markers_genes )
}
第二部分结束,准备进入第三部分
第三部分免疫细胞识别
免疫细胞的识别,一般情况下分为两种
第一种就是你自己一直知道某些基因和自己要找的特定的免疫细胞相关
这里你可以参考文献,也可以自己定义,非常的自由
这种方法不止针对免疫细胞,而且针对所有你自己想 diy 识别的细胞,只要能够找到靶dna
例如以下这些代表基因:
epithelial/cancer (EpCAM+,EPCAM),
immune (CD45+,PTPRC),
stromal (CD10+,MME,fibo or CD31+,PECAM1,endo)
rm(list=ls())
options(stringsAsFactors = F)
library(Seurat)
library(ggplot2)
load(file = 'first_sce.Rdata')
sce=sce.first
rm(sce.first)

genes_to_check = c("PTPRC","EPCAM",'PECAM1','MME',"CD3G","CD3E", "CD79A")
p = DotPlot(sce, features = genes_to_check,
             assay='RNA' )

p = p$data
p = p[which((p$pct.exp>50) & p$avg.exp.scaled>-0.5),]

imm = p[which(p$features.plot == 'PTPRC'),]$id %>% as.character()
epi = p[which(p$features.plot == 'EPCAM'),]$id %>% as.character()
stromal=setdiff(as.character(0:27),c(imm,epi));
例如按照文章的定义
genes_to_check = c("PTPRC","EPCAM","CD3G","CD3E", "CD79A", "BLNK","MS4A1", "CD68", "CSF1R",
                   "MARCO", "CD207", "PMEL", "ALB", "C1QB", "CLDN5", "FCGR3B", "COL1A1")
# All on Dotplot
p = DotPlot(sce, features = genes_to_check) + coord_flip()
p
#然后根据自定义规则区分细胞
[外链图片转存失败,源站可能有防盗链机制,建议将图片保存下来直接上传(img-k0GADJ7e-1614138377395)(https://tva1.sinaimg.cn/large/0081Kckwly1gkir4ahlx2j31hf0u0tf5.jpg)]
sce@meta.data$immune_annotation = ifelse(sce@meta.data$seurat_clusters  %in% imm ,'immune',
                                         ifelse(sce@meta.data$seurat_clusters  %in% epi ,'epi','stromal') )
# MAke a table
table(sce@meta.data$immune_annotation)

p = TSNEPlot(object = sce, group.by = 'immune_annotation')
p

genes_to_check = c("PTPRC","EPCAM","CD3G","CD3E", "CD79A", "BLNK","MS4A1", "CD68", "CSF1R",
                   "MARCO", "CD207", "PMEL", "ALB", "C1QB", "CLDN5", "FCGR3B", "COL1A1")
# All on Dotplot
p = DotPlot(sce, features = genes_to_check,group.by = 'immune_annotation') + coord_flip()
p
# Generate immune and non-immune cell lists
phe=sce@meta.data
table(phe$immune_annotation)
save(phe,file = 'phe-of-first-anno.Rdata')
[外链图片转存失败,源站可能有防盗链机制,建议将图片保存下来直接上传(img-5KHP0V24-1614138377396)(https://tva1.sinaimg.cn/large/0081Kckwly1gkir4m54zej30u00yb7wh.jpg)]
其实,细胞注释到这里已经结束了,其实不难发现,细胞注释这个流程,没有什么难的,只需要做两件事情
- 定义基因,根据基因集合画点图 DotPlot + coord_flip()
- 根据点图自己定义什么是什么细胞
那么到这里的话基本上面免疫细胞大群体已经区分开了,下一步就是直接对大群体内部细分
rm(list=ls())
options(stringsAsFactors = F)
library(Seurat)
library(ggplot2)
load(file = 'first_sce.Rdata')
load(file = 'phe-of-first-anno.Rdata')
sce=sce.first
table(phe$immune_annotation)
sce@meta.data=phe
# 既然是对免疫群体内部分类,则只需要提取免疫细胞就行
cells.use = row.names(sce@meta.data)[which(phe$immune_annotation=='immune')]
length(cells.use)
sce =subset(sce, cells=cells.use)
sce
# 走标准流程,一直走到 TSNE
#1.Normalize data
require(Seurat)
sce = NormalizeData(object = sce, normalization.method =  "LogNormalize",scale.factor = 1e6)

#2.Find variable genes
sce = FindVariableFeatures(object = sce, selection.method = "vst", nfeatures = 2000)

#3.Scale data
sce = ScaleData(object = sce)

#4.Perform PCA
sce = RunPCA(object = sce, pc.genes = VariableFeatures(sce))
ElbowPlot(sce)
VizDimLoadings(sce, dims = 1:5, reduction = "pca", nfeatures = 10)
DimHeatmap(sce, dims = 1:10, cells = 100, balanced = TRUE)
pca.obj = sce@reductions$pca
pc.coords = pca.obj@cell.embeddings
df1 = sce@meta.data[,c("nFeature_RNA","nCount_RNA","percent.rp")]
df2 = pc.coords[,c(1:10)]
cordf12 = cor(df1,df2)
# Make a correlation plot
library(corrplot)
# 补一张相关性图
corrplot(cordf12, method = "number", main="Correlation of PCs and metadata")

#5. Construct Neighbor graph
sce = FindNeighbors(object = sce, dims = 1:15)

#6. 分辨率
tiss_subset = FindClusters(object = tiss_subset, verbose = T, resolution = 1)

#7. Run and project TSNEs
sce = RunTSNE(sce, dims = 1:15)
# 可视化
DimPlot(sce, reduction = "tsne", label = T)
DimPlot(sce,reduction = "tsne",label=T, group.by = "patient_id")
TSNEPlot(object = sce, do.label = F, group.by = "driver_gene")
TSNEPlot(object = sce, do.label = F, group.by = "patient_id")
tab=table(sce@meta.data$seurat_clusters,sce@meta.data$patient_id)
balloonplot(tab)
根据参考数据库自动化注释
sce_for_SingleR = GetAssayData(sce, slot="data")
sce_for_SingleR
library(SingleR)
# 根据数据库进行自动注释
hpca.se = HumanPrimaryCellAtlasData() # 这个要搞非常久
hpca.se
[email protected]$seurat_clusters
clusters[1:5]
# test 稀疏矩阵
# ref 参考数据库
table( hpca.se$label.main)

pred.hesc = SingleR(test = sce_for_SingleR, ref = hpca.se, labels = hpca.se$label.main,
                     method = "cluster", clusters = clusters,
                     assay.type.test = "logcounts", assay.type.ref = "logcounts")
table(pred.hesc$labels)
celltype = data.frame(ClusterID=rownames(pred.hesc), celltype=pred.hesc$labels, stringsAsFactors = F)
[email protected]$singleR=celltype[match(clusters,celltype$ClusterID),'celltype']
DimPlot(sce, reduction = "tsne", group.by = "singleR")
[email protected]
table(phe$singleR)
save(phe,file = 'phe-of-subtypes-Immune-by-singleR.Rdata')
[外链图片转存失败,源站可能有防盗链机制,建议将图片保存下来直接上传(img-eV5QDrSR-1614138377396)(https://tva1.sinaimg.cn/large/0081Kckwly1gkir4we5j5j31ir0u01kx.jpg)]
小结
那么这里再一次的简单总结一下细胞注释的流程(并不只是免疫细胞,任何的都可以):
首先我们需要找出和要注释的细胞的相关的基因
graph TB
找出注释细胞相关基因-->绘制点图
绘制点图-->根据自定义阈值确定细胞类型
根据自定义阈值确定细胞类型-->提取感兴趣的类
提取感兴趣的类-->走标准流程1-7
走标准流程1-7-->数据库自动化注释
不同的注释库的功能不太一样(这些都是大佬整理好的,讲实话我很好奇这些数据库都是哪儿找的)
?MonacoImmuneData
?BlueprintEncodeData
?DatabaseImmuneCellExpressionData
?NovershternHematopoieticData
?MonacoImmuneData
?ImmGenData
?MouseRNAseqData
?HumanPrimaryCellAtlasData
其他的细胞类型注释流程几乎完全一样,如果后续需要个性化分析,只需要提取出自己识别好的类,然后在这些类中继续走标准流程 1-7,之后还是使用点图进行验证,单纯的只是多了个 group.by 参数而已
第三部分结束,准备进入第四部分
第四部分癌细胞识别
这个癌细胞识别略微小复杂,通常的流程是在已知的细胞类别上继续进行分类。
这种分类方式大部分也都是属于人工自己筛选的
例如在上皮细胞中识别癌细胞和非癌细胞
rm(list=ls())
options(stringsAsFactors = F)
library(Seurat)
library(ggplot2)
load(file = 'first_sce.Rdata')
load(file = 'phe-of-first-anno.Rdata')
sce=sce.first
rm(sce.first)
table(phe$immune_annotation)
[email protected]=phe
# 那么第一步就是提取上皮细胞中的癌细胞
cells.use = row.names([email protected])[which(phe$immune_annotation=='epi')]
length(cells.use)
sce = subset(sce, cells=cells.use)
sce
# 走标准流程,一直走到 TSNE
#1.Normalize data
require(Seurat)
sce = NormalizeData(object = sce, normalization.method =  "LogNormalize",scale.factor = 1e6)

#2.Find variable genes
sce = FindVariableFeatures(object = sce, selection.method = "vst", nfeatures = 2000)

#3.Scale data
sce = ScaleData(object = sce)

#4.Perform PCA
sce = RunPCA(object = sce, pc.genes = VariableFeatures(sce))
ElbowPlot(sce)
VizDimLoadings(sce, dims = 1:5, reduction = "pca", nfeatures = 10)
DimHeatmap(sce, dims = 1:10, cells = 100, balanced = TRUE)
pca.obj = sce@reductions$pca
pc.coords = [email protected]
df1 = [email protected][,c("nFeature_RNA","nCount_RNA","percent.rp")]
df2 = pc.coords[,c(1:10)]
cordf12 = cor(df1,df2)
# Make a correlation plot
library(corrplot)
# 补一张相关性图
corrplot(cordf12, method = "number", main="Correlation of PCs and metadata")

#5. Construct Neighbor graph
sce = FindNeighbors(object = sce, dims = 1:15)

#6. 分辨率
tiss_subset = FindClusters(object = tiss_subset, verbose = T, resolution = 1)

#7. Run and project TSNEs
sce = RunTSNE(sce, dims = 1:15)
# 可视化
DimPlot(sce, reduction = "tsne", label = T)
DimPlot(sce,reduction = "tsne",label=T, group.by = "patient_id")
TSNEPlot(object = sce, do.label = F, group.by = "driver_gene")
TSNEPlot(object = sce, do.label = F, group.by = "patient_id")
tab=table([email protected]$seurat_clusters,[email protected]$patient_id)
balloonplot(tab)
这里的话就存在一个前提假设,如果细胞会跨患者聚类则这些细胞不是癌细胞
[外链图片转存失败,源站可能有防盗链机制,建议将图片保存下来直接上传(img-JUUMdTTy-1614138377397)(https://tva1.sinaimg.cn/large/0081Kckwly1gkir56lncoj31hm0u01kx.jpg)]
tab = tab %>% as.matrix()
ids = apply(tab,1,function(x){ x/sum(x) })
nonCancer = which(apply(ids,2,max)<0.85) %>% colnames(ids)[.]

[email protected]$cancer <-ifelse([email protected]$seurat_clusters %in% nonCancer ,'non-cancer','cancer')
# MAke a table
table([email protected]$cancer)
[email protected]

# cancer marker CEACAM6, cell-cycle-related gene CCND2, and apoptosis-related gene BAX
genes_to_check = c("CEACAM6","CCND2","BAX")
# All on Dotplot
p <- DotPlot(sce, features = genes_to_check,group.by = 'cancer') + coord_flip()
p

save(phe,file = 'phe-of-cancer-or-not.Rdata')
其实到这里癌细胞注释和上一步的免疫细胞注释几乎一样
所以下面介绍 inferCNV 的算法
在使用 infercnv其实只有 2 行代码而已
重要的是引导文件的构建
- 第一个引导文件是 count 矩阵
- 第二个引导文件是 label 信息 (第一列是细胞 ID;第二列是细对应的细胞类型,这个数据是由前面的分析结果得到的)
- 第三个引导文件是样本染色体或基因信息(这个获取方法有很多种,1.抄大佬代码(推荐),2.自己下载)
rm(list=ls())
options(stringsAsFactors = F)
library(Seurat)
library(ggplot2)
load(file = 'first_sce.Rdata')
load(file = 'phe-of-first-anno.Rdata')
sce=sce.first
table(phe$immune_annotation)
[email protected]=phe
table(phe$immune_annotation,phe$seurat_clusters)
# BiocManager::install("infercnv")
library(infercnv)
##### inferCNV引导文件的构建
# 上皮细胞 count 矩阵
epi.cells  = row.names([email protected])[which(phe$immune_annotation=='epi')]
epiMat=as.data.frame(GetAssayData(subset(sce,
                                         cells=epi.cells), slot='counts'))
# 间质细胞
cells.use = row.names([email protected])[which(phe$immune_annotation=='stromal')]
sce =subset(sce, cells=cells.use)
load(file = 'phe-of-subtypes-stromal.Rdata')
fib.cells  =  row.names([email protected])[phe$singleR=='Fibroblasts']
endo.cells  =  row.names([email protected])[phe$singleR=='Endothelial_cells']

# 成纤细胞 count 矩阵
fibMat=as.data.frame(GetAssayData(subset(sce,
                                         cells=fib.cells),  slot='counts'))
# 内皮细胞 count 矩阵
endoMat=as.data.frame(GetAssayData(subset(sce,
                                          cells=endo.cells),  slot='counts'))
#合并
dat=cbind(epiMat,fibMat,endoMat)
ids1 = data.frame(cellId = colnames(epiMat))
ids2 = data.frame(cellId = colnames(fibMat))
ids3 = data.frame(cellId = colnames(endoMat))
ids1$cellType = 'epi'
ids2$cellType = 'Fibroblasts'
ids3$cellType = 'Endothelial_cells'
data.frame(ids1,ids2,ids3)
groupFiles = rbind(ids1,ids2) %>% rbind(.,ids3) %>% as.data.frame
rm(epiMat,fibMat,endoMat,ids1,ids2,ids3)

library(AnnoProbe)
geneInfor=annoGene(rownames(dat),"SYMBOL",'human')
geneInfor=geneInfor[with(geneInfor, order(chr, start)),c(1,4:6)]
geneInfor=geneInfor[!duplicated(geneInfor[,1]),]
## 这里可以去除性染色体
# 也可以把染色体排序方式改变
dat=dat[rownames(dat) %in% geneInfor[,1],]
dat=dat[match( geneInfor[,1], rownames(dat) ),]
dim(dat)
expFile='expFile.txt'
write.table(dat,file = expFile,sep = '\t',quote = F)
groupFiles='groupFiles.txt'
head(groupinfo)
write.table(groupinfo,file = groupFiles,sep = '\t',quote = F,col.names = F,row.names = F)
head(geneInfor)
geneFile='geneFile.txt'
write.table(geneInfor,file = geneFile,sep = '\t',quote = F,col.names = F,row.names = F)

table(groupinfo[,2])
以上就是构建三个引导文件的代码
最终引导文件分别张这样:
> dat[1:5,1:5] #count 矩阵
          A10_1001000407 A10_1001000408 A10_1001000412 A10_B000863 A10_B001470
DDX11L1                0              0              0           0           0
WASH7P                 0              0              0           0           0
MIR6859-1              0              0              0           0           0
MIR1302-2              0              0              0           0           0
FAM138A                0              0              0           0           0

> groupinfo[1:5,]# 分组矩阵
          cellId cellType
1 A10_1001000407      epi
2 A10_1001000408      epi
3 A10_1001000412      epi
4    A10_B000863      epi
5    A10_B001470      epi

> geneInfor[1:5,]#染色体或基因信息
     SYMBOL  chr start   end
1   DDX11L1 chr1 11869 14409
2    WASH7P chr1 14404 29570
3 MIR6859-1 chr1 17369 17436
5 MIR1302-2 chr1 30366 30503
6   FAM138A chr1 34554 36081
然后就直接跑流程就可以
# 这个注意一下这个流程跑起来非常慢,不知道是我的电脑的问题还是怎么回事
# 大概是我中午睡了一觉起来还没好
rm(list=ls())
options(stringsAsFactors = F)
library(Seurat)
library(ggplot2)
library(infercnv)
expFile='expFile.txt'
groupFiles='groupFiles.txt'
geneFile='geneFile.txt'
infercnv_obj = CreateInfercnvObject(raw_counts_matrix=expFile,
                                    annotations_file=groupFiles,
                                    delim="\t",
                                    gene_order_file= geneFile,
                                    ref_group_names=c('Fibroblasts','Endothelial_cells'))  ## 这个是 normalcell 的 grouplabel


##  文献的代码:
infercnv_obj2 = infercnv::run(infercnv_obj,
                              cutoff=1,
                              out_dir=  'plot_out/inferCNV_output2' ,
                              cluster_by_groups=F,   # cluster
                              hclust_method="ward.D2", plot_steps=F)

### 可以添加 denoise=TRUE以及 HMM=TRUE
最后就是 inferCNV 的结果解读了
link1
link2
全文总结
其实,单细胞从头到尾的流程就那么几个代码,感觉有 70%以上的都是重复的
- 数据预处理,确保 count 数据能够和 metadata 一一对应
- 计算外源RNA的百分比,添加到 metadata;删除 count 矩阵中的外源 RNA 信息
- 构建 seurat 对象,计算 MT,RP 百分比信息
- 根据相应的信息自主选择过滤,一般都是过滤基因,细胞,MT 百分比,RP 百分比
- 第一轮基础流程,然后保存数据
- 后续的所谓的个性化分析都是基于特定的细胞群体
- 细胞群体的识别方法按这个流程的话只有一种,就是找到特定的基因,画点图然后提取
- 反复的根据提取的子细胞群落用第 5 步存下来的数据一直跑基础流程,一直画点图,TSNE
- 如果做 inferCNV 只要做好引导文件即可,除了修改
ref_group_names以外不懂的情况下一个字别改
如果您觉得我的文章对您有帮助,请点赞+关注,可以的话打个赏奖励一杯星巴克(~ ̄(OO) ̄)ブ
Best Regards,
Yuan.SH;
School of Basic Medical Sciences,
Fujian Medical University,
Fuzhou, Fujian, China.
please contact with me via the following ways:
(a) e-mail :[email protected]


