统计分析——回归分析
回归分析
- 概念
- 回归分析的步骤
- 一元线性回归
-
- 一元线性回归模型
- 一元线性回归方程
- 参数的最小二乘法估计
- 利用回归直线进行估计和预测
-
- 估计标准误差的计算
- 置信区间估计
- 在1 — α置信水平下预测区间
- 影响区间宽度的因素
- 回归直线的拟合优度
- 判定系数
- 显著性检验
-
- 线性关系检验
- 回归系数检验
- 两个检验的区别
- 多元线性回归
-
- 调整的多重判定系数
- 曲线回归分析
- 多重共线性
-
- 多重共线性检验的主要方法
-
- 容忍度
- 方差膨胀因子
- Python工具包介绍
-
- Statsmodels
-
- 一元线性回归
- 高阶回归
- 分类变量
- Scikit-learn
- 实战:汽车价格预测
-
- 数据字典
- 数据读取与分析
- 缺失值处理(NaN)
- 特征相关性
- 预处理
- Lasso回归
概念
在统计学中,回归分析(regression analysis)指的是确定两种或两种以上变量间相互依赖的定量关系的一种统计分析方法。回归分析按照涉及的变量的多少,分为一元回归和多元回归分析;按照因变量的多少,可分为简单回归分析和多重回归分析;按照自变量和因变量之间的关系类型,可分为线性回归分析和非线性回归分析。
在大数据分析中,回归分析是一种预测性的建模技术,它研究的是因变量(目标)和自变量(预测器)之间的关系。这种技术通常用于预测分析,时间序列模型以及发现变量之间的因果关系。
回归分析的步骤
- 确定回归方程的解释变量和被解释变量。
- 确定回归模型,建立回归方程。
- 对回归方程进行各种验证。
- 利用回归方程进行预测。
一元线性回归
一元线性回归模型
如果只有一个自变量X,而且因变量Y和自变量X之间的数量变化关系呈近似线性关系,就可以建立一元线性回归方程,由自变量X的值来预测因变量Y的值,这就是一元线性回归预测。
如果因变量Y和自变量X之间呈线性相关,那就是说,对于自变量X的某一值 xi ,因变量Y对应的取值 yi 不是唯一确定的,而是有很多的可能取值,它们分布在一条直线的上下,这是因为Y还受除自变量以外的其他因素的影响。这些因素的影响大小和方向都是不确定的,通常用一个随机变量(记为ε)来表示,也称为随机扰动项。于是,Y和X之间的依存关系可表示为:

α —— 截距
β —— 斜率
ε —— 误差项,反映除x和y的线性关系之外的随机因素对y的影响
一元线性回归方程
- 如果回归方程的参数已知,对于一个给定的x值,利用回归方程就能计算出y的期望值。
- 用样本统计量代替回归方程中的位置参数,就得到估计回归方程,简称回归直线。
参数的最小二乘法估计
对于回归直线,关键在于求解参数,常用高斯提出的最小二乘法,它是使因变量的观察值y与估计值之间的离差平方和达到最小来求解。

展开可得:

我们求Q的极小值点,对其求偏导(β0和β1):

求解得:

利用回归直线进行估计和预测
- 点估计:利用估计的回归方程,对于x的某一个特定得值,求出y得一个估计值。
- 区间估计:利用估计得回归方程,对于x的一个特定值,求出y的一个估计值的区间。
估计标准误差的计算
为了度量回归方程的可靠性,通常计算估计的标准误差。它度量观察值回绕着回归直线的变化程度或分散程度。
估计平均误差:

- 自由度为:n-2(由两个不能改变参数)。
- 估计标准误差越大,则数据点围绕回归直线的分散程度越大,回归方程大的代表性越小。
- 估计标准误差越小,则数据点围绕回归直线的分散程度越小,回归方程大的代表性越大,即可靠性高。
置信区间估计
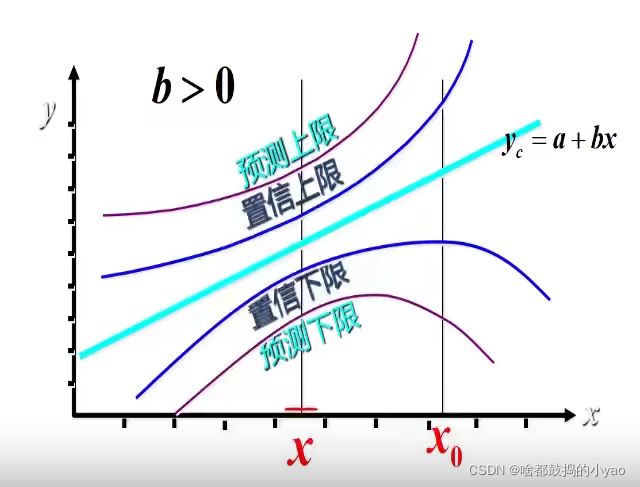
在1 — α置信水平下预测区间
影响区间宽度的因素
- 置信水平(1 - α), 区间宽度随置信水平的增大而增大。
- 数据的离散程度Se,区间宽度随离散程度的增大而增大。
- 样本容量,区间宽度随样本容量的增大而减小。
- X0与X均值之间的差异,随差异程度的增大而增大。
回归直线的拟合优度
回归直线与各观测点的接近程度称为回归直线对数据的拟合优度。
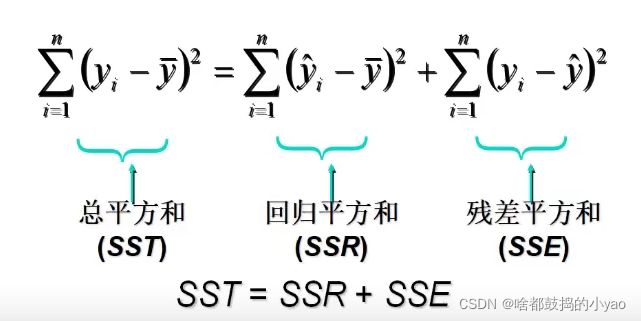
总平方和可以分解为回归平方和、残差平方和两部分:SST=SSR+SSE
- SST反映因变量的n个观察值与其均值的总离差。
- SSR反映了y的总变差中,由于x与y的线性关系引起的y的变化部分。
- SSE反映了除了x对y的线性影响之外的其他因素对y变差的作用,是不能由回归直线来解释的y的变差部分。
判定系数
回归平方和占总平方的比例,用R^2表示,其值在0到1之间。
显著性检验
显著性检验的主要目的是根据所建立的估计方程用自变量x来估计或预测因变量y的取值。当建立了估计方程后,还不能马上进行估计或预测,因为该估计方程是根据样本数据得到的,它是否真实的反映了变量x和y之间的关系,需要通过检验后才能证实。
根据样本数据拟合回归方程时,实际上就已经假定变量x与y之间存在着线性关系,并假定误差项是一个服从正态分布的随机变量,且具有相同的方差。但这些假设是否成立需要检验,显著性检验包括两方面:
- 线性关系检验
- 回归系数检验
线性关系检验
线性关系检验是检验自变量x和因变量y之间的线性关系是否显著或者说,它们之间能否用一个线性模型来表示。
讲均方回归(MSR)同均方残差(MSE)加以比较,应用F检验来分析二者之间的差别是否显著。
- 均方回归:回归平方和SSR除以相应的自由度(自变量个数K)
- 均方残差:残差平方和SSE除以相应的自由度(n-k-1)
H0:β1=0所有回归系数与0无显著差异,y与全体x的线性关系不显著。
回归系数检验
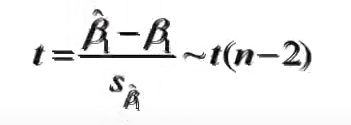
回归系数显著性检验的目的是通过检验回归系数β的值与0是否有显著性差异,来判断Y与X之间是否有显著性线性关系。若β=0,则总体回归方程中不含X项(即Y不随X变动而变动),因此变量Y与X之间不存在线性关系;若β≠0,说明变量Y与X之间存在显著的线性关系。

计算检验的统计量:
两个检验的区别
线性关系的检验是检验自变量与因变量是否可以用线性来表达,而回归系数的检验是对样本数据计算的回归系数检验总体中回归系数是否为0。
- 在一元线性回归中,自变量只有一个,线性关系检验与回归系数检验是等价的。
- 多元回归分析中,这两种检验的意义是不同的。线性关系检验只能用来检验总体回归关系的显著性,而回归系数检验可以对各个回归系数分别进行检验。
多元线性回归
经常遇到某一现象的发展变化取决于几个影响因素的情况,也就是一个因变量和几个自变量有依存关系的情况,这时需用多元线性回归分析。
- 多元线性回归分析预测法,是指通过对两及其以上的自变量与一个因变量的相关性分析,建立预测模型进行预测和控制的方法。
调整的多重判定系数
用样本容量n和自变量的个数k去修正R^2得到:

避免增加自变量而高估R^2
曲线回归分析
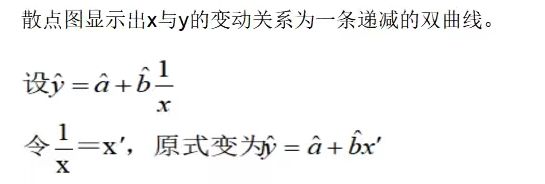
直线关系是两变量间最简单的一种关系,曲线回归分析的基本任务是通过两个相关变量x与y的实际观测数据建立曲线回归方程,以揭示x与y间的曲线联系的形式。
曲线分析最困难和首要的工作是确定自变量与因变量的曲线关系的类型,曲线回归分析的基本过程:
- 将x或y进行变量转换。
- 对新变量进行直线回归分析、建立直线回归方程并进行显著性检验和区间估计。
- 将新变量还原为原变量,由新变量的直线回归方程和置信区间得出原变量的曲线回归方程和置信区间。
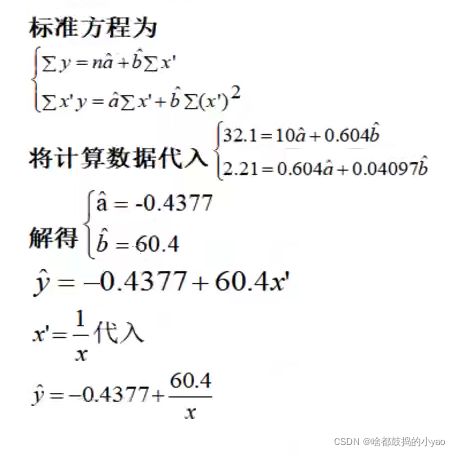
由于曲线回归模型种类繁多,所以没有通用的回归方程可直接使用。但是对于某些特殊的回归模型,可以通过变量代换、取对数等方法对其线性化,然后使用标准方程求解参数,再将参数带回原方程就是所求。
多重共线性
回归模型中两个或两个以上的自变量彼此相关的现象
多重共线性带来的问题:
- 回归系数估计值的不稳定增强
- 回归系数假设检验的结果不显著等
多重共线性检验的主要方法
- 容忍度
- 方差膨胀因子(VIF)
容忍度

Ri是解释变量xi与方程中其他解释变量间的复相关系数;
容忍度在0~1之间,越接近于0,表示多重共线性越强。
方差膨胀因子
VIFi越大,特别是>=10,说明解释变量xi与方程中其他解释变量之间有严重的多重共线性;
VIFi越接近于1,表明解释变量xi和其他解释变量之间的多重共线性越弱。
Python工具包介绍
Statsmodels
用来做统计分析
Statsmodels 是一个 Python 模块,它提供用于估计许多不同统计模型以及进行统计测试和统计数据探索的类和函数。 每个估算器都有一个广泛的结果统计列表。 对照现有的统计数据包对结果进行测试,以确保它们是正确的。 该软件包是在开源修改 BSD(3 条款)许可下发布的。
一元线性回归
# 导入功能包,产生数据
import numpy as np
import matplotlib.pyplot as plt
import statsmodels.api as sm

nsample = 20 # 20个样本点
x = np.linspace(0,10,nsample) # 从0到20之间选择20个数(等距)
print(x)
[ 0. 0.52631579 1.05263158 1.57894737 2.10526316 2.63157895
3.15789474 3.68421053 4.21052632 4.73684211 5.26315789 5.78947368
6.31578947 6.84210526 7.36842105 7.89473684 8.42105263 8.94736842
9.47368421 10. ]
# 加一列1,为了与常数项进行组合
X = sm.add_constant(x)
print(X)
[[ 1. 0. ]
[ 1. 0.52631579]
[ 1. 1.05263158]
[ 1. 1.57894737]
[ 1. 2.10526316]
[ 1. 2.63157895]
[ 1. 3.15789474]
[ 1. 3.68421053]
[ 1. 4.21052632]
[ 1. 4.73684211]
[ 1. 5.26315789]
[ 1. 5.78947368]
[ 1. 6.31578947]
[ 1. 6.84210526]
[ 1. 7.36842105]
[ 1. 7.89473684]
[ 1. 8.42105263]
[ 1. 8.94736842]
[ 1. 9.47368421]
[ 1. 10. ]]
# 产生β0与β1(真实情况)
beta = np.array([2,5])
print(beta)
[2 5]
# 误差项(设置抖动,为了让数据更真实)
e = np.random.normal(size=nsample)
print(e)
[ 0.82944189 1.67229293 0.39780164 1.24295698 1.475433 0.8642918
-0.34345566 1.03677286 0.26148177 -1.03382748 -0.09721028 0.66122185
-0.54803173 0.40733307 0.32082923 1.38139669 -0.81902716 0.45718195
1.31683565 1.03592956]
# 实际值y
y = np.dot(X,beta) + e
print(y)
[ 2.82944189 6.30387188 7.66095953 11.13769382 14.00174879 16.02218654
17.44601802 21.45782549 23.31411335 24.65038305 28.2185792 31.60859027
33.03091564 36.61785938 39.1629345 42.8550809 43.286236 47.19402405
50.6852567 53.03592956]
# 最小二乘法
model = sm.OLS(y,X)
# 拟合数据
res = model.fit()
# 计算的回归系数β0和β1
print(res.params)
[2.77235974 4.95072454]
# 产生全部结果
res.summary()
# 拟合的估计值
y_ = res.fittedvalues
print(y_)
[ 2.77235974 5.37800424 7.98364873 10.58929322 13.19493772 15.80058221
18.4062267 21.0118712 23.61751569 26.22316018 28.82880467 31.43444917
34.04009366 36.64573815 39.25138265 41.85702714 44.46267163 47.06831613
49.67396062 52.27960511]
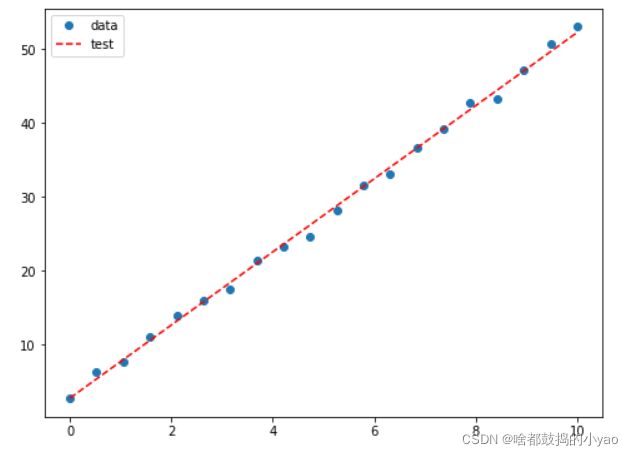
fig, ax = plt.subplots(figsize=(8,6))
ax.plot(x,y,'o',label='data') # 原始数据
ax.plot(x,y_,'r--',label='test') # 拟合数据
ax.legend(loc='best')
plt.show()
高阶回归
# Y=5+2X+3X^2

nsample=50
x=np.linspace(0,10,nsample)
X=np.column_stack((x,x**2)) # 添加原始数据
X=sm.add_constant(X)
# 则X的第一列为1,第二列为x,第三列为x^2
# 构造beta
beta=np.array([5,2,3]) # 真实值
e=np.random.normal(size=nsample) # 误差
y=np.dot(X,beta)+e # 产生y真实值
model=sm.OLS(y,X) # 最小二乘法
results=model.fit()
results.params # 计算最终系数值
[4.93081682, 2.22120911, 2.97636437]
# 产生全部结果
results.summary()
# 画图展示结果
y_fitted=results.fittedvalues
fit,ax=plt.subplots(figsize=(8,6))
ax.plot(x,y,'o',label='data')
ax.plot(x,y_fitted,'r--.',label='OLS')
ax.legend(loc='best')
plt.show()
分类变量
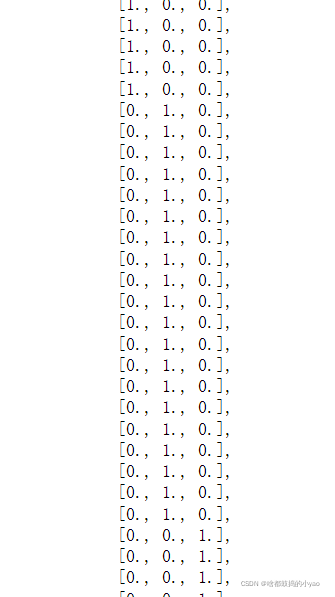
假设分类变量有3个取值(a,b,c),比如考试成绩有3个等级。那么a就是(1,0,0),b(0,1,0),c(0,0,1),这个时候就需要3个系数β0,β1,β2,也就是β0x0+β1x1+β2x2。
# 构造0列表
nsample=50
groups=np.zeros(nsample,int)
groups
array([0, 0, 0, 0, 0, 0, 0, 0, 0, 0, 0, 0, 0, 0, 0, 0, 0, 0, 0, 0, 0, 0,
0, 0, 0, 0, 0, 0, 0, 0, 0, 0, 0, 0, 0, 0, 0, 0, 0, 0, 0, 0, 0, 0,
0, 0, 0, 0, 0, 0])
# 转化为矩阵
groups[20:40]=1
groups[40:]=2
dummy=sm.categorical(groups,drop=True) #转化类型
dummy
# Y=5+2X+3Z1+6*Z2+9*Z3.

x = np.linspace(0,20,nsample)
X=np.column_stack((x,dummy))
X=sm.add_constant(X)
beta=[5,2,3,6,9]
e=np.random.normal(size=nsample)
y=np.dot(X,beta)+e
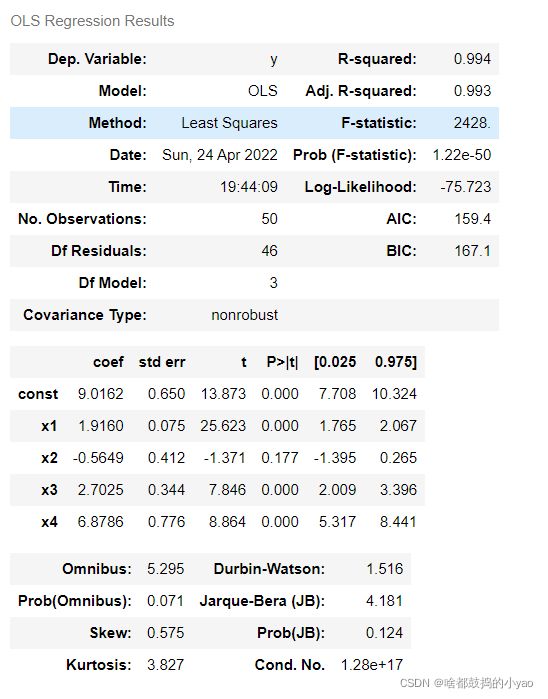
result=sm.OLS(y,X).fit()
result.summary()
# 画图
fig, ax=plt.subplots(figsize=(8,6))
ax.plot(x,y,'o',label="data")
ax.plot(x,result.fittedvalues,'r--',label="OLS")
ax.legend(loc='best')
plt.show()
Scikit-learn
用来做机器学习
Scikit-learn(以前称为scikits.learn,也称为sklearn)是针对Python 编程语言的免费软件机器学习库 。它具有各种分类,回归和聚类算法,包括支持向量机,随机森林,梯度提升,k均值和DBSCAN,并且旨在与Python数值科学库NumPy和SciPy联合使用。
实战:汽车价格预测
数据字典

数据来源: https://archive.ics.uci.edu/ml/datasets/Automobile
数据读取与分析
# 加载功能包
import numpy as np
import pandas as pd
import datetime

# 数据可视化和缺失值
import matplotlib.pyplot as plt
import seaborn as sns # 高级可视化
import missingno as msno # 对缺失值进行可视化展示
%matplotlib inline

# 统计数据
from statsmodels.distributions.empirical_distribution import ECDF
from sklearn.metrics import mean_squared_error, r2_score

# 机器学习
from sklearn.preprocessing import StandardScaler
from sklearn.linear_model import Lasso, LassoCV
from sklearn.model_selection import train_test_split, cross_val_score
from sklearn.ensemble import RandomForestRegressor
seed=123 # 随机种子(控制随机因素)

# 读取数据集
data = pd.read_csv("CarPrice_Assignment.csv", na_values = '?')
data.columns
Index([‘car_ID’, ‘symboling’, ‘CarName’, ‘fueltype’, ‘aspiration’,
‘doornumber’, ‘carbody’, ‘drivewheel’, ‘enginelocation’, ‘wheelbase’,
‘carlength’, ‘carwidth’, ‘carheight’, ‘curbweight’, ‘enginetype’,
‘cylindernumber’, ‘enginesize’, ‘fuelsystem’, ‘boreratio’, ‘stroke’,
‘compressionratio’, ‘horsepower’, ‘peakrpm’, ‘citympg’, ‘highwaympg’,
‘price’],
dtype=‘object’)
# 查看数据类型
data.dtypes
car_ID int64
symboling int64
CarName object
fueltype object
aspiration object
doornumber object
carbody object
drivewheel object
enginelocation object
wheelbase float64
carlength float64
carwidth float64
carheight float64
curbweight int64
enginetype object
cylindernumber object
enginesize int64
fuelsystem object
boreratio float64
stroke float64
compressionratio float64
horsepower int64
peakrpm int64
citympg int64
highwaympg int64
price float64
dtype: object
# 查看数据本身
print("IN total:",data.shape)
data.head(5)
# 显示CSV中的数值信息
data.describe()
缺失值处理(NaN)
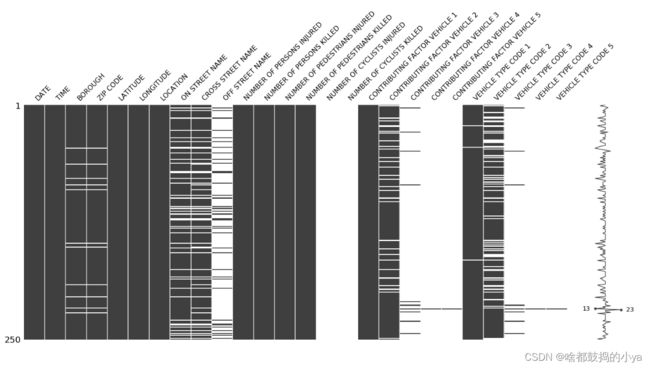
当然本案例是没有缺失值的,若有需要用missingno功能包进行可视化展示,要么去掉缺失值,要么用平均值或者众数、中位数替代。
# 查看缺失值
sns.set(style = "ticks") # 指定风格
msno.matrix(data)
# 展示缺失值数据
data[pd.isnull(data['normalized-losses'])].head()
# 进行数据分布分析,然后选择填充数据
sns.set(style = "ticks")
plt.figure(figsize = (12, 5))
c = '#366DE8'

# ECDF
plt.subplot(121)
cdf = ECDF(data['normalized-losses'])   #查看连续分布,累计结果
plt.plot(cdf.x, cdf.y, label = "statmodels", color = c);
plt.xlabel('normalized losses'); plt.ylabel('ECDF');

# overall distribution
plt.subplot(122)
plt.hist(data['normalized-losses'].dropna(),
         bins = int(np.sqrt(len(data['normalized-losses']))),
         color = c);
# 按照不同的风险等级分成不同的组,然后观察每组缺失值情况
data.groupby([symboling])["normalized-losses"].describe()
# 使用最相关数值进行填充
data = data.dropna(subset = ['price', 'bore', 'stroke', 'peak-rpm', 'horsepower', 'num-of-doors']) #对于缺失值少的几列,直接删掉缺失值
data['normalized-losses'] = data.groupby('symboling')['normalized-losses'].transform(lambda x: x.fillna(x.mean()))  #填充缺失值
print('In total:', data.shape)
data.head()
特征相关性
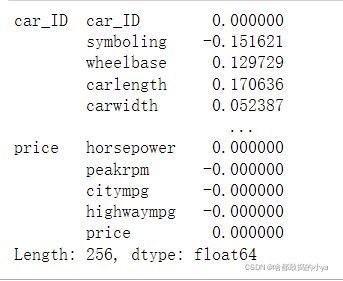
cormatrix = data.corr()
cormatrix
cormatrix *= np.tri(*cormatrix.values.shape, k=-1).T  #返回函数的上三角矩阵,把对角线上的置0,让他们不是最高的。
cormatrix
#某一指标与其他指标的关系
cormatrix = cormatrix.stack()
cormatrix
# 按照从大到小排序
cormatrix = cormatrix.reindex(cormatrix.abs().sort_values(ascending=False).index).reset_index()
cormatrix
# 选择相关系数大的一个影响因素即可
# 并选择本身性质关系的一个即可(如长宽高—>体积)
data['volume'] = data.carlength * data.carwidth * data.carheight

data.drop(['carwidth', 'carlength', 'carheight',
           'curbweight', 'citympg'],
          axis = 1, # 1 for columns
          inplace = True)
# 新变量
data.columns
Index([‘car_ID’, ‘symboling’, ‘CarName’, ‘fueltype’, ‘aspiration’,
‘doornumber’, ‘carbody’, ‘drivewheel’, ‘enginelocation’, ‘wheelbase’,
‘enginetype’, ‘cylindernumber’, ‘enginesize’, ‘fuelsystem’, ‘boreratio’,
‘stroke’, ‘compressionratio’, ‘horsepower’, ‘peakrpm’, ‘highwaympg’,
‘price’, ‘volume’],
dtype=‘object’)
# 画出相关性的热度图

# 计算相关矩阵
corr_all = data.corr()

# 为上三角形生成蒙版
mask = np.zeros_like(corr_all, dtype = np.bool)
mask[np.triu_indices_from(mask)] = True

# 设置 matplotlib 图
f, ax = plt.subplots(figsize = (11, 9))

# 使用蒙版和正确的纵横比绘制热图
sns.heatmap(corr_all, mask = mask,
            square = True, linewidths = .5, ax = ax, cmap = "BuPu")
plt.show()
# 统计每一个指标的情况
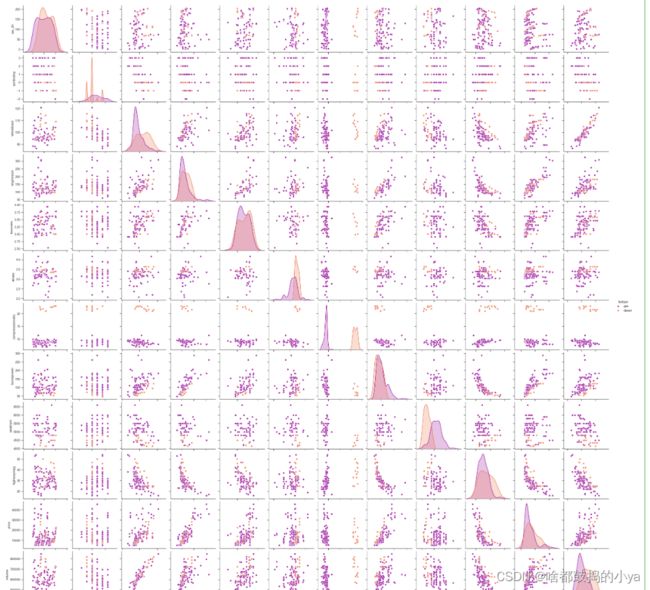
sns.pairplot(data, hue = 'fueltype', palette = 'plasma')
# 返回的是当前对于不同变量来说的各种图
# 按照hue的指标,把数据分为几种
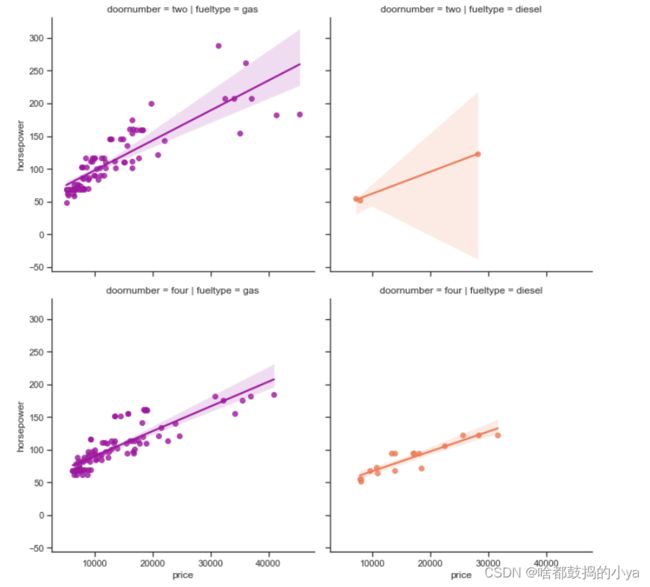
# 某几个指标之间的关系
sns.lmplot('price', 'horsepower', data,
           hue = 'fueltype', col = 'fueltype',  row = 'doornumber',
           palette = 'plasma',
           fit_reg = True);
#参数:1指定横轴;2指定纵轴;传进数据data;hue按照哪个变化(参数的个数);col按列区分;row按行区分
预处理
对连续值进行标量化
# 目标和特点
target = data.price

regressors = [x for x in data.columns if x not in ['price']]
features = data.loc[:, regressors]

num = ['symboling', 'volume', 'horsepower', 'wheelbase',
       'boreratio', 'stroke','compressionratio', 'peakrpm']

# 缩放数据
standard_scaler = StandardScaler() # 进行特征标准化
features[num] = standard_scaler.fit_transform(features[num])

# 展示结果
features.head()
# 对分类属性进行one-bot编码

# 分类变量
classes = ['CarName', 'fueltype', 'aspiration', 'doornumber',
           'carbody', 'drivewheel', 'enginelocation',
           'enginetype', 'cylindernumber', 'fuelsystem']

# 仅使用 continios vars 创建新数据集
dummies = pd.get_dummies(features[classes])
features = features.join(dummies).drop(classes, axis = 1)

# 新数据集
print('In total:', features.shape)
features.head()
# 划分数据集,按照30%划分(训练集和测试集)
X_train, X_test, y_train, y_test = train_test_split(features, target, test_size = 0.3,random_state = seed)
print("Train", X_train.shape, "and test", X_test.shape)
Train (143, 196) and test (62, 196)
Lasso回归
多加了一个绝对值想来惩罚过大的系数:alphas=0那就是最小二乘了。
# 对数刻度:以 2 为底的对数
# 高值将更多变量归零
alphas = 2. ** np.arange(2, 20) #指定alphas的范围
scores = np.empty_like(alphas)

# 测试集
for i, a in enumerate(alphas):
    lasso = Lasso(random_state = seed) # 指定模型
    lasso.set_params(alpha = a)
    lasso.fit(X_train, y_train)
    scores[i] = lasso.score(X_test, y_test)


# 交叉验证cross validation
lassocv = LassoCV(cv = 10, random_state = seed)
lassocv.fit(features, target)
lassocv_score = lassocv.score(features, target)
lassocv_alpha = lassocv.alpha_

plt.figure(figsize = (10, 4))
plt.plot(alphas, scores, '-ko')
plt.axhline(lassocv_score)
plt.xlabel(r'$\alpha$')
plt.ylabel('CV Score')
plt.xscale('log', basex = 2)
sns.despine(offset = 15)

print('CV results:', lassocv_score, lassocv_alpha)
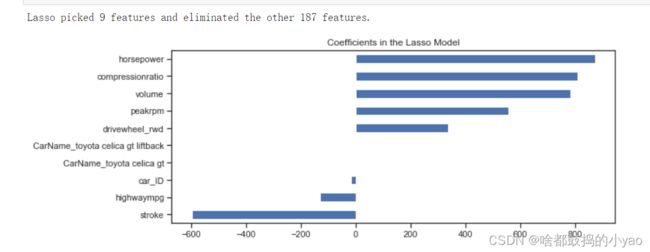
# 特征重要性分析
# lassocv 系数
coefs = pd.Series(lassocv.coef_, index = features.columns)

# 打印出选择/消除特征的数量
print("Lasso picked " + str(sum(coefs != 0)) + " features and eliminated the other " +  \
      str(sum(coefs == 0)) + " features.")

# 展示前5个和后5个
coefs = pd.concat([coefs.sort_values().head(5), coefs.sort_values().tail(5)])

plt.figure(figsize = (10, 4))
coefs.plot(kind = "barh")
plt.title("Coefficients in the Lasso Model")
plt.show()
# 选择上面计算出来的最好的Alphas,进行预测
model_l1 = LassoCV(alphas = alphas, cv = 10, random_state = seed).fit(X_train, y_train)
y_pred_l1 = model_l1.predict(X_test)

model_l1.score(X_test, y_test)
0.8156778549898953
# residual plot 残差图——画图表示实际值和预测值之间的差异
plt.rcParams['figure.figsize'] = (6.0, 6.0)

preds = pd.DataFrame({"preds": model_l1.predict(X_train), "true": y_train})
preds["residuals"] = preds["true"] - preds["preds"]
preds.plot(x = "preds", y = "residuals", kind = "scatter", color = "c")
#计算指标:MSE和R2
def MSE(y_true,y_pred):
    mse = mean_squared_error(y_true, y_pred)
    print('MSE: %2.3f' % mse)
    return mse

def R2(y_true,y_pred):
    r2 = r2_score(y_true, y_pred)
    print('R2: %2.3f' % r2)
    return r2

MSE(y_test, y_pred_l1); R2(y_test, y_pred_l1);
MSE: 6033979.103
R2: 0.816
# 结果预测
d = {'true' : list(y_test),
     'predicted' : pd.Series(y_pred_l1)
    }

pd.DataFrame(d).head()


