人工智能导论实验——线性回归
1.实验目的
熟悉利用线性回归对样本点数据进行拟合的方法
2.实验任务
基于随机生成的数据,进行线性回归实验,实现对数据的拟合
线性回归原理:
有n组数据,自变量x(x1,x2,…,xn),因变量y(y1,y2,…,yn),然后我们假设它们之间的关系是:f(x)=ax+b。那么线性回归的目标就是如何让f(x)和y之间的差异最小,在回归问题中,均方误差是回归任务中最常用的性能度量。1.⽣成⼀个包含1000个样本的数据集,每个样本包含从标准正态分布中采样的1个特征。
使⽤线性模型参数w = [2]⊤、b = 4.2 和噪声项ϵ⽣成数据集及其标签:y = Xw + b + ϵ.

2.定义模型,将模型的输⼊和参数同模型的输出关联起来。
3.定义损失函数,因为需要计算损失函数的梯度,所以应该先定义损失函数。这⾥使⽤均⽅损失函数。
4.训练模型,在每次迭代中,读取⼀⼩批量训练样本,并通过模型来获得⼀组预测。计算完损失后,开始反向传播,存储每个参数的梯度。最后,调⽤优化算法sgd来更新模型参数。
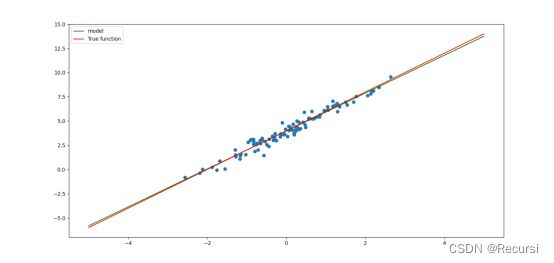
最后得到w为1.99,b为4.00

源码:
import torch
import numpy as np
from torch import nn
from torch.utils import data
import matplotlib.pyplot as plt
true_w = torch.tensor([2]).float()
true_b = 4
'''生成 y=Xw+b+噪声'''
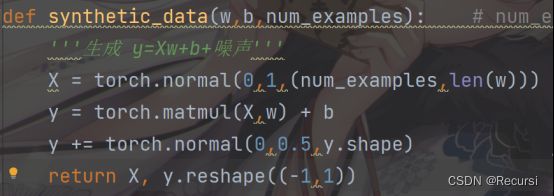
def synthetic_data(w,b,num_examples):    # num_examples:n个样本
    '''生成 y=Xw+b+噪声'''
    X = torch.normal(0,1,(num_examples,len(w)))  #生成 X,他是一个均值为0,方差为1的随机数,他的大小: 行为num_examples,列为w的长度表示多少个feature
    y = torch.matmul(X,w) + b
    y += torch.normal(0,0.5,y.shape)            #加入一些噪音,均值为0 ,方差为0.01,形状和y是一样
    return X, y.reshape((-1,1))

features, labels = synthetic_data(true_w, true_b, 100)

class linear(torch.nn.Module):
    def __init__(self):
        super(linear, self).__init__()
        self.linear = torch.nn.Linear(1,1)

    def forward(self,x):
        y_pred = self.linear(x)
        return y_pred

model = linear()

loss = torch.nn.MSELoss(reduction='sum')

optimizer = torch.optim.SGD(model.parameters(),lr = 0.001)

epoch_list = []
loss_list = []

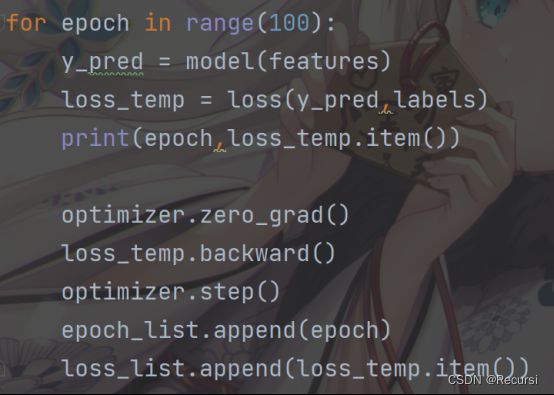
for epoch in range(100):
    y_pred = model(features)
    loss_temp = loss(y_pred,labels)
    print(epoch,loss_temp.item())

    optimizer.zero_grad()
    loss_temp.backward()
    optimizer.step()
    epoch_list.append(epoch)
    loss_list.append(loss_temp.item())
print('w = ',model.linear.weight.item())
print('b = ',model.linear.bias.item())
a = model.linear.weight.item()
b = model.linear.bias.item()
x_plot = np.linspace(-5, 5, 5)
y_plot = x_plot * 2 + 4
x_ = np.linspace(-5, 5, 5)
y_ = x_plot * a + b
plt.plot(x_.reshape(-1,1), y_.reshape(-1,1), color='green')
plt.plot(x_plot.reshape(-1,1), y_plot.reshape(-1,1), color='red')
plt.scatter(features, labels)
plt.legend(["model","True function"])
plt.show()


plt.plot(epoch_list, loss_list)
plt.xlabel('times')
plt.ylabel('loss')
plt.title('SGD')
plt.show()

