R实战 | 聚类分析
R中有各种各样的聚类分析函数。本文主要介绍其中的三种方法:层次聚集、划分聚类、基于模型的聚类。
数据准备
聚类分析之前,可以对数据进行预处理,如包括缺失值的处理和数据的标准化。以鸢尾花数据集(iris)为例。
# 数据预处理
mydata <- iris[,1:4]
mydata <- na.omit(mydata) # 删除缺失值
mydata <- scale(mydata) # 数据标准化
Partitioning(划分)
K-means 是我们最常用的基于欧式距离的聚类算法,其认为两个目标的距离越近,相似度越大。需要分析者先确定要将这组数据分成多少类,也即聚类的个数。根据所提取的簇数绘制出组内的平方和,可以帮助确定合适的簇数。
# 探索最佳聚类个数
# 计算不同个数聚类内部的距离平方和
wss <- (nrow(mydata)-1)*sum(apply(mydata,2,var))
for (i in 2:15) wss[i] <- sum(kmeans(mydata,centers=i)$withinss)
plot(1:15, wss, type="b",
xlab="Number of Clusters",
ylab="Within groups sum of squares")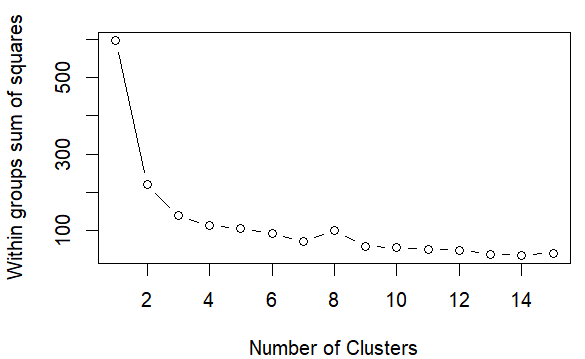 WSS
WSS
WSS下降趋于稳定的聚类数即为我们的最佳聚类。如图,聚类个数为4时满足要求。(3-5都差不多,并没有唯一聚类数)
# K-Means 聚类分析
fit <- kmeans(mydata, 4) # 聚类数为4
# 每个聚类的均值
aggregate(mydata,by=list(fit$cluster),FUN=mean)
# 添加聚类列
mydata_result <- data.frame(mydata, fit$cluster)
层次聚类
R语言提供了丰富的层次聚类函数,这里简单介绍一下用Ward方法进行的层次聚类分析。
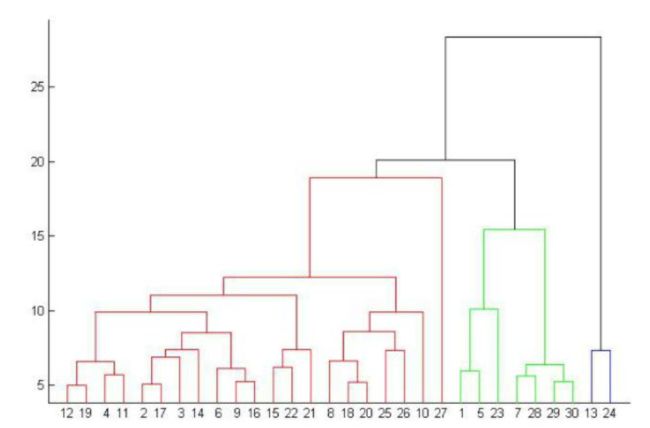
层次的聚类方法(Hierarchical Clustering),从字面上理解,其是层次化的聚类,最终得出来的是树形结构。专业一点来说,层次聚类通过 计算不同类别数据点间的相似度 来创建一棵有层次的嵌套聚类树。
层次聚类的好处是不需要指定具体类别数目的,其得到的是一颗树,聚类完成之后,可在任意层次横切一刀,得到指定数目的簇。
 聚类数示例
聚类数示例
# Ward 层次聚类
d <- dist(mydata, method = "euclidean") #距离矩阵
fit <- hclust(d, method="ward")
plot(fit) # 聚类树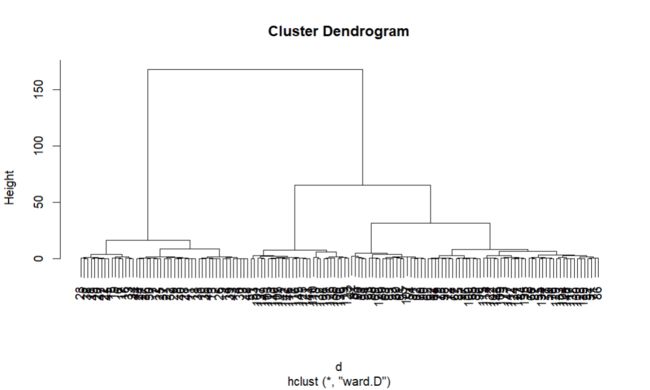
groups <- cutree(fit, k=3) # 将聚类树切成3个聚类
rect.hclust(fit, k=3, border="red")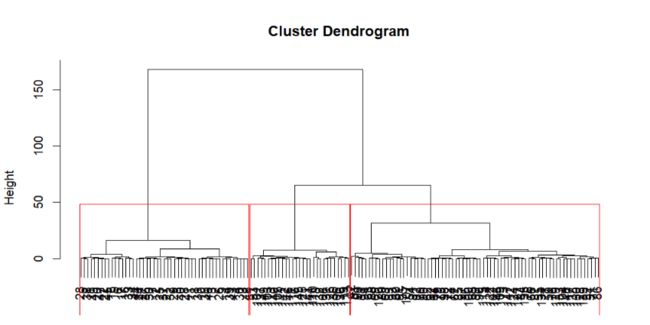
pvclust包中的pvclust()函数提供了基于多尺度bootstrap重采样的分层聚类的p值。得到数据高度支持的聚类将具有较大的p值。
# Ward Hierarchical Clustering with Bootstrapped p values
library(pvclust)
fit <- pvclust(mydata, method.hclust="ward",
method.dist="euclidean")
plot(fit) # dendogram with p values
# add rectangles around groups highly supported by the data
pvrect(fit, alpha=.95)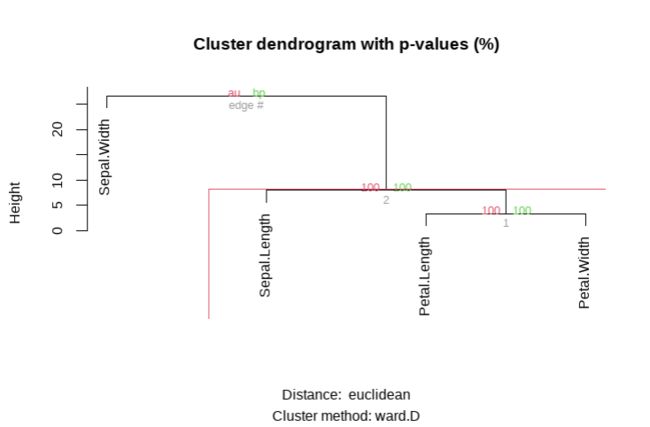 pvclust
基于模型聚类
基于模型的聚类方法利用极大似然估计法和贝叶斯准则在大量假定的模型中去选择最佳的聚类模型并确定最佳聚类个数。其中,对于参数化高斯混合模型,Mclust包中的Mclust()函数根据分层聚类初始化EM的BIC选择最优模型。
# Model Based Clustering
library(mclust)
fit <- Mclust(mydata)
plot(fit) # plot results
summary(fit) # display the best model
Mclust
> summary(fit) # display the best model
----------------------------------------------------
Gaussian finite mixture model fitted by EM algorithm
----------------------------------------------------

Mclust VVV (ellipsoidal, varying volume, shape, and orientation) model with 2 components:

 log-likelihood   n df       BIC       ICL
      -322.6936 150 29 -790.6956 -790.6969

Clustering table:
  1   2
 50 100
从上面的结果来看,分为两个聚类效果更好。
聚类可视化
# K-Means Clustering with 5 clusters
fit <- kmeans(mydata, 3)
# vary parameters for most readable graph
library(cluster)
clusplot(mydata, fit$cluster, color=TRUE, shade=TRUE,
labels=2, lines=0)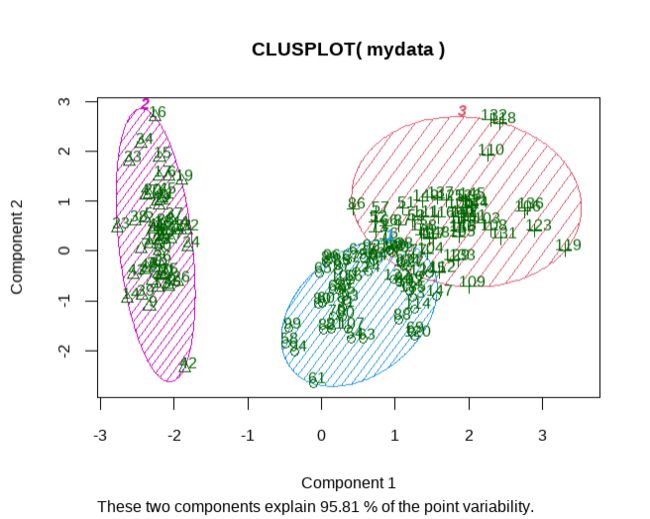 clusplot
# Centroid Plot against 1st 2 discriminant functions
install.packages('fpc')
library(fpc)
plotcluster(mydata, fit$cluster)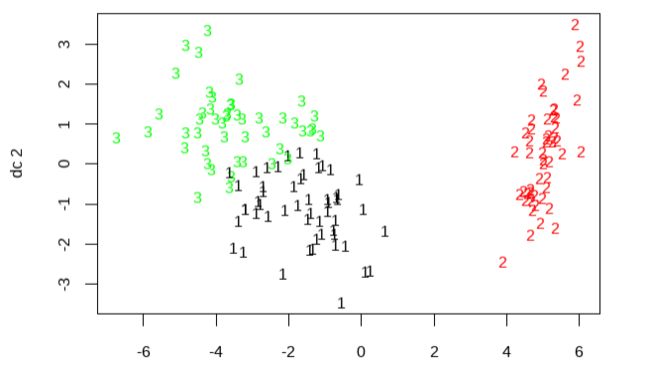 fpc
fpc
参考
Quick-R: Cluster Analysis (statmethods.net)(https://www.statmethods.net/advstats/cluster.html)
木舟笔记2022年度VIP企划
权益:
收费:
99¥/人。可添加微信:mzbj0002 转账,或直接在文末打赏。
 扫描二维码添加微信


