超燃,拿来即用!Echarts动态排名柱状图(自适应电脑和手机端)说明文档
项目说明
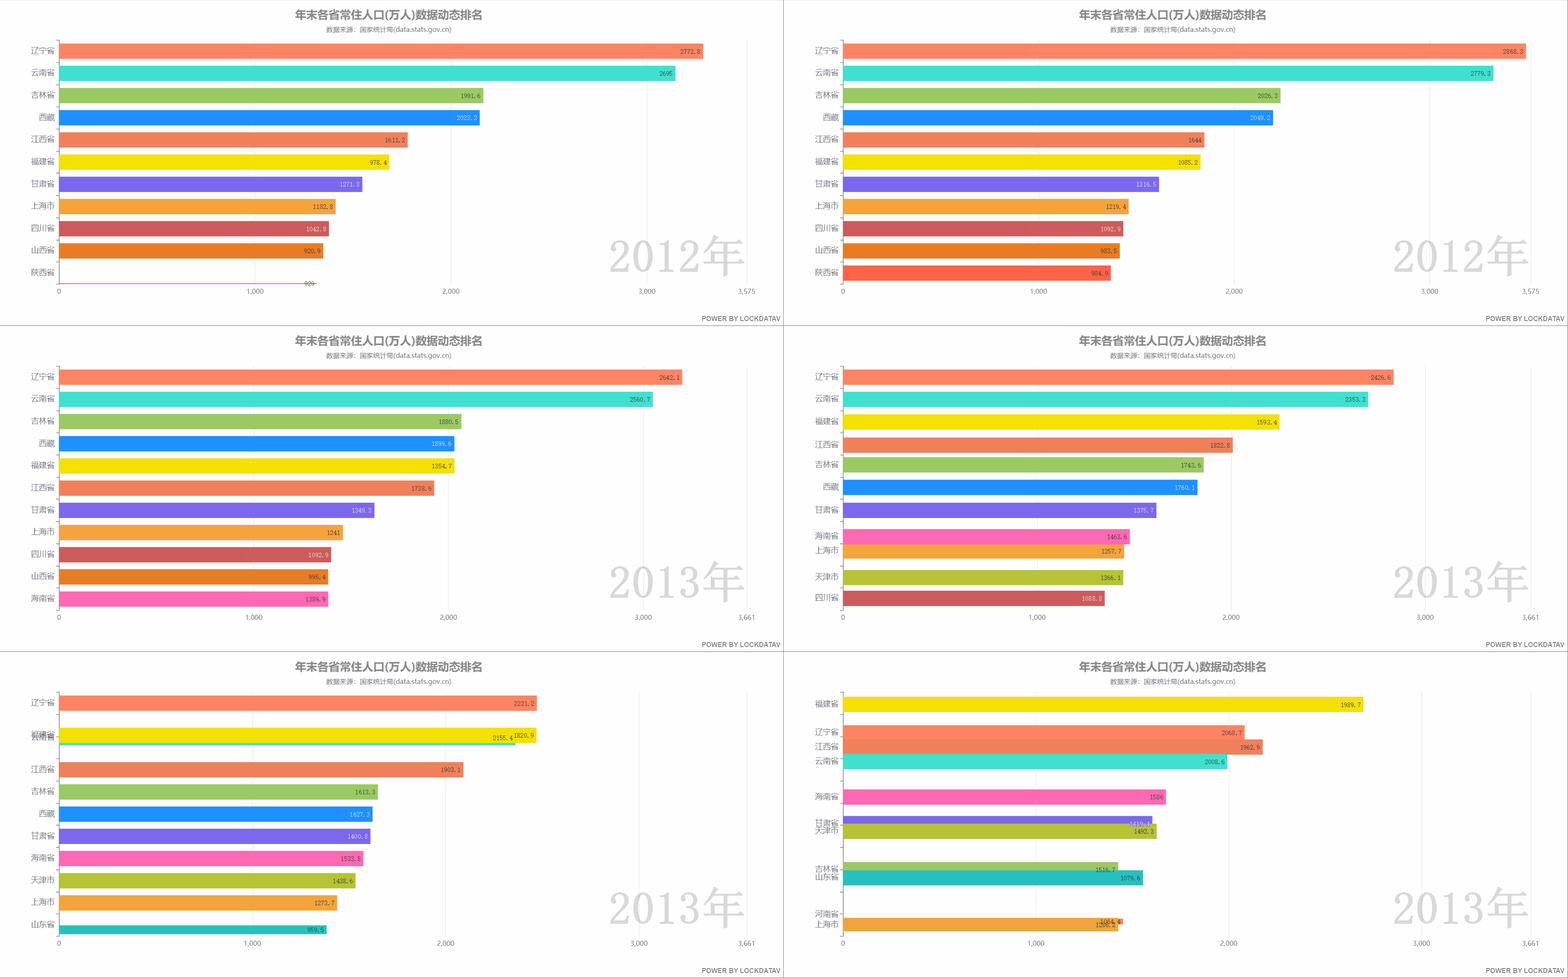
动态排名柱状图能很好的表达在某一个时间周期,随着时间的变化,各参数指标的增减变化,形象直观,让人很容易理解。
- 项目人性化,仅需在Excel中录入数据,点击start.exe即可运行;
- 无需过度配置,如果数据量少导致动画卡顿,config.js中调整间隔时间即可;
- 自适应PC端和手机端;
- 本地可以直接运行;如果在服务器端访问,首次或修改表格文件启动start.exe生成数据即可;
- 源代码:https://download.csdn.net/download/weixin_41290949/29952910
开发说明
- 基于百度开运Echarts 5.0开发;
- 自带python应用执行程序start.exe,读取excel并转化为json数据
项目目录
├─index.html …图表静态文件
├─start.exe …启动程序
├─css …样式表目录
│ ├─common.css …核心样式表
├─js …JS封装库
│ ├─config.js …图表常用参数配置文件
│ ├─echarts5.min.js …echarts封装库
│ ├─jquery-3.3.1.min.js …jquery封装库
├─data …数据文件
│ ├─lockdata.xls …源数据文件
│ ├─data.json …动态产生的JSON数据
配置文件
/*
 * *Created by Poleung
 * *Email [email protected]
 * *Create date 2021-10-08
 * *Copyright LockDataV
 * *Desc data visualization project based on echarts5.0.js.
 */

//标题名称;
var title = '各省市历年GDP数据可视化动态排名';

/*子标题*/
var subtext = '数据来源:全国1949-2016年GDP数据统计(纯属虚构)';

/*主标题字号*/
var titleSize = '20';

/*参数说明:更新间隔时间
* 根据数据量的多少调整
* 2*1000,代表2秒
* */
var updateFrequency = 2000;

/*参数说明:选择第N列数据
* 0代表选择Excel第1列数据作为排序指标
* */
var dimension = 0;

/*参数说明:Y轴显示数量
* 默认显示10条数据
* */
var maxData = 10;

/*参数说明:柱图颜色数组
* 根据数据唯一名称数量总数调整个数
* */
var barColors = [
    '#C1232B', '#B5C334', '#FCCE10', '#E87C25', '#27727B',
    '#FE8463', '#9BCA63', '#FAD860', '#F3A43B', '#60C0DD',
    '#D7504B', '#C6E579', '#F4E001', '#F0805A', '#26C0C0',
    '#ff7f50', '#87cefa', '#da70d6', '#32cd32', '#6495ed',
    '#ff69b4', '#ba55d3', '#cd5c5c', '#ffa500', '#40e0d0',
    '#1e90ff', '#ff6347', '#7b68ee', '#00fa9a', '#ffd700',
    '#6b8e23', '#ff00ff', '#3cb371', '#b8860b', '#30e0e0'
];

/*参数说明:柱图文本标签显示位置
 *参数选项:
 'top'
 'left'
 'right'
 'bottom'
 'inside'
 'insideLeft'
 'insideRight'
 'insideTop'
 'insideBottom'
 'insideTopLeft'
 'insideBottomLeft'
 'insideTopRight'
 'insideBottomRight'
 */
var yPosition = 'insideRight';
核心图表
//构建容器并初始化DOM;
    var myChart = echarts.init(document.getElementById("container"));
    //获取数据并加载;
    $.when(
        $.getJSON('data/data.json')
    ).done(function (res) {
        //获取数据集;
        var data = res;

        //获取年份;
        var years = [];
        for (var i = 0; i < data.length; ++i) {
            if (years.length === 0 || years[years.length - 1] !== data[i][4]) {
                years.push(data[i][4]);
            }
        }

        //开始年份;
        var startIndex = 1;
        var startYear = years[startIndex];

        //图表配置项;
        var option = {
            title: {
                x: 'center',
                text: title,
                subtext: subtext,
                top: '2%',
                textStyle: {
                    fontSize: titleSize,
                    color: 'rgba(121,121,121, 0.9)'
                }
            },
            grid: {
                left: '5%',
                right: '5%',
                top: '15%',
                bottom: '10%',
                containLabel: true
            },
            xAxis: {
                max: 'dataMax',
                label: {
                    formatter: function (n) {
                        return Math.round(n);
                    }
                }
            },
            dataset: {
                source: data.slice(1).filter(function (d) {
                    return d[4] === startYear;
                })
            },
            yAxis: {
                type: 'category',
                inverse: true,
                max: maxData,//显示柱图数量
                axisLabel: {
                    show: true,
                    textStyle: {
                        fontSize: 14
                    },
                    formatter: function (value) {
                        return value;
                    }
                },
                animationDuration: 300,
                animationDurationUpdate: 300
            },
            series: [{
                realtimeSort: true,
                seriesLayoutBy: 'column',
                type: 'bar',
                itemStyle: {
                    color: function (param) {
                        return barColors[param.dataIndex] || '#5470c6';
                    }
                },
                encode: {
                    x: dimension,
                    y: 3
                },
                label: {
                    show: true,
                    precision: 1,
                    position: yPosition,//文本标签显示位置
                    valueAnimation: true,
                    fontFamily: 'monospace'
                }
            }],
            // Disable init animation.
            animationDuration: 0,
            animationDurationUpdate: updateFrequency,
            animationEasing: 'linear',
            animationEasingUpdate: 'linear',
            graphic: {
                elements: [{
                    type: 'text',
                    right: "5%",
                    bottom: "15%",
                    style: {
                        text: startYear,
                        font: 'bolder 80px monospace',
                        fill: 'rgba(100, 100, 100, 0.25)'
                    },
                    z: 100
                }]
            }
        };

        myChart.setOption(option);
        window.addEventListener("resize", function () {
            myChart.resize();
        });

        //循环数据;
        for (var i = startIndex; i < years.length - 1; ++i) {
            (function (i) {
                setTimeout(function () {
                    updateYear(years[i + 1]);
                }, (i - startIndex) * updateFrequency);
            })(i);
        }

        //更新年份;
        function updateYear(year) {
            var source = data.slice(1).filter(function (d) {
                return d[4] === year;
            });
            option.series[0].data = source;
            option.graphic.elements[0].style.text = year;
            myChart.setOption(option);
            window.addEventListener("resize", function () {
                myChart.resize();
            });
        }
    })
后台服务代码
# -*- coding: UTF-8 -*-
# @Time : 2021-10-09 8:29
# @File : start.py
# @Author : LockDataV

import xlrd
import os
import json
from http.server import HTTPServer, SimpleHTTPRequestHandler
import webbrowser

# 读取excel数据并将其转为js文件
filename = r'data/lockdata.xls'

# 判断文件是否存在
file_data = os.path.exists(filename)
if not file_data:
    print("系统默认data.xls表格文件不存在.")
else:
    print("系统获取到文件,处理中...")
    data = xlrd.open_workbook(filename)  # 文件名以及路径,如果路径或者文件名有中文给前面加一个r不转义。
    # 获取你要sheet的名称
    sheet_name = data.sheet_names()
    # 根据sheet索引或者名称获取sheet内容
    sheet = data.sheet_by_index(0)
    # 获取整行和整列的值(列表)
    rows = sheet.row_values(0)  # 获取第1行内容

    # 自定义数组
    tables = []
    data = {}
    for rown in range(sheet.nrows):
        array = [sheet.cell_value(rown, 0), sheet.cell_value(rown, 1), sheet.cell_value(rown, 2), sheet.cell_value(rown, 3), sheet.cell_value(rown, 4)]
        tables.append(array)
    # print(tables)

    # 转为JSON
    res = json.dumps(tables, ensure_ascii=False)
    print(res)

    # 生成对应的JSON数据文件
    content = '{}'.format(res)

    # 写入文件
    with open(r'data/data.json', 'w', encoding="utf-8") as f:
        f.write(content)

    print("数据转换完成..")


# 创建http server
class GetHttpServer(SimpleHTTPRequestHandler):
    protocol_version = "HTTP/1.0"
    server_version = "PSHS/0.1"
    sys_version = "Python/3.9.x"
    target = "./"  # 监听目录,配置项

    def do_get(self):
        SimpleHTTPRequestHandler.do_GET(self)

    def do_post(self):
        print("postmsg recv, path error")
        data = self.rfile.read(int(self.headers["content-length"]))
        data = json.loads(data)
        self.send_response(200)
        self.send_header("Content-type", "text/html")
        self.end_headers()
        rspstr = "recv ok, data = "
        rspstr += json.dumps(data, ensure_ascii=False)
        self.wfile.write(rspstr.encode("utf-8"))


def http_server():
    ip = "localhost"  # 监听IP,配置项
    port = 8800  # 监听端口,配置项
    index_url = "http://{}:{}/index.html".format(ip, port)  # 监听主页url,配置项
    server = HTTPServer((ip, port), GetHttpServer)
    try:
        # 弹出窗口
        webbrowser.open(index_url)
        # 输出信息
        print("服务器监听地址: ", index_url)
        server.serve_forever()
    except KeyboardInterrupt:
        server.socket.close()


# 执行服务器脚本
http_server()
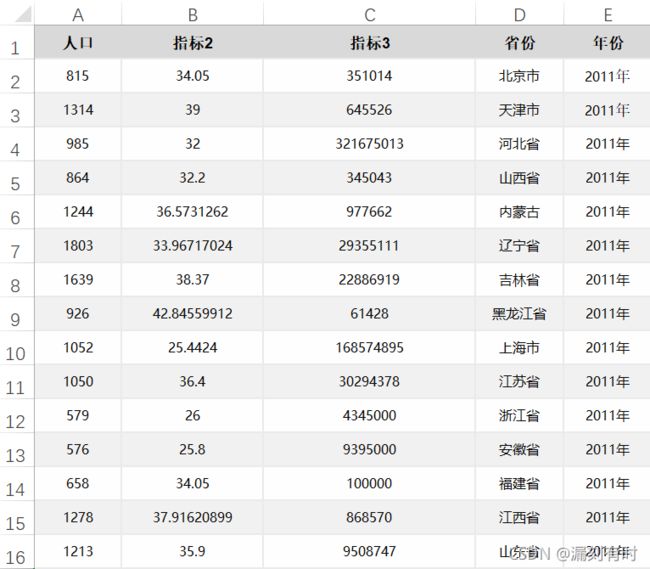
Excel数据结构
lockdatav Done!

