day4-聚类文章CONVEX BICLUSTERING
1、本文将双聚类作为一个凸优化问题,提出了一种新的凸双聚类算法(COBRA)来迭代求解。COBRA输出的结果保留了聚类树图的简单可解释性和可视化,并且与现有技术相比还有几个关键优势:
- 稳定性和唯一性:COBRA为凸规划产生唯一的全局最小化,该最小化在数据中是连续的,这意味着COBRA总是将数据映射到单个双聚类分配,并且这个解决方案是稳定的;
- 简单性:COBRA采用单个调谐参数来控制双簇的数量;
- 数据自适应性:COBRA允许一个简单而有原则的数据自适应过程,用于选择涉及解决凸矩阵完成问题的调整参数。
2、L2范数是指向量各元素的平方和,然后求其平方根。(这个值也就是向量的模即向量的长度),由于向量旋转对于长度是不变的,所以根据L2范数的定义可知其大小与旋转变换无关,故L2范数具有旋转不变性。
3、优化问题的两大难题
- 局部最小值
- ill-condition病态问题,对于输入的细微改变会引起输出的巨大变化,说明系统不稳定。
4、条件数(condition-number),是一个矩阵的稳定性或敏感的的度量,如果一个矩阵的条件数在1附近,那么它就是well-conditioned,如果远大于1,那么它就是ill-conditioned.
5、矩阵范数,假设 A ∈ R n × n A\in R^{n\times n} A∈Rn×n,其矩阵范数定义为:
∣ ∣ A ∣ ∣ = m a x x ≠ 0 ∣ ∣ A x ∣ ∣ ∣ ∣ x ∣ ∣ ||A||=\underset{x\ne0}{max} {\frac{||Ax||}{||x||}} ∣∣A∣∣=x=0max∣∣x∣∣∣∣Ax∣∣
其中 ∣ ∣ x ∣ ∣ ||x|| ∣∣x∣∣是某一向量范数,下面举几个典型范数例子:
l 1 l_{1} l1矩阵范数(列和范数)
∣ ∣ A ∣ ∣ 1 = m a x j ∣ ∣ a . j ∣ ∣ 1 = m a x j ∑ i = 1 n ∣ a i j ∣ ||A||_{1}=\underset{j}{max} {||a_{.j}||_{1}}=\underset{j}{max} \sum_{i=1}^{n}|a_{ij}| ∣∣A∣∣1=jmax∣∣a.j∣∣1=jmaxi=1∑n∣aij∣
l ∞ l_{\infty} l∞矩阵范数(行和范数)
∣ ∣ A ∣ ∣ ∞ = m a x i ∣ ∣ a i . ∣ ∣ 1 = m a x i ∑ j = 1 n ∣ a i j ∣ ||A||_{\infty}=\underset{i}{max} {||a_{i.}||_{1}}=\underset{i}{max} \sum_{j=1}^{n}|a_{ij}| ∣∣A∣∣∞=imax∣∣ai.∣∣1=imaxj=1∑n∣aij∣
l 2 l_{2} l2矩阵范数(谱范数)
∣ ∣ A ∣ ∣ 2 = ( λ A T A ) 1 2 ||A||_{2}=(\lambda_{A^TA})^{\frac{1}{2}} ∣∣A∣∣2=(λATA)21
其中, λ A T A \lambda_{A^TA} λATA表示 A T A A^TA ATA的最大特征值, a . j a_{.j} a.j表示 A A A的第 j j j列, a i . a_{i.} ai.表示 A A A的第 i i i行。
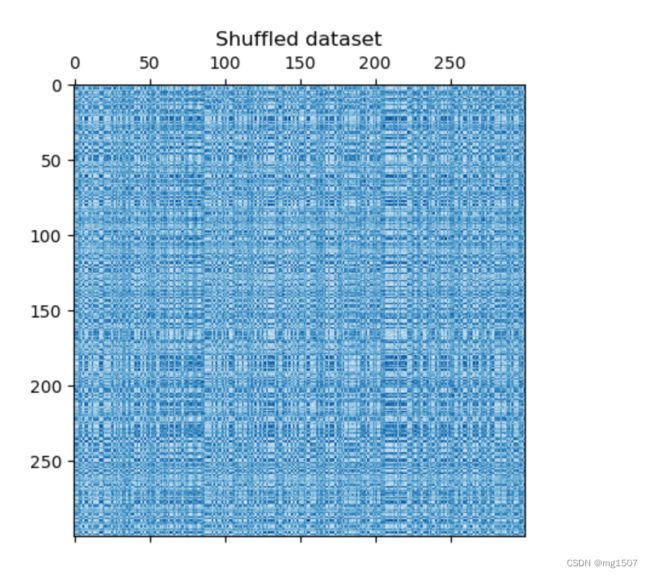
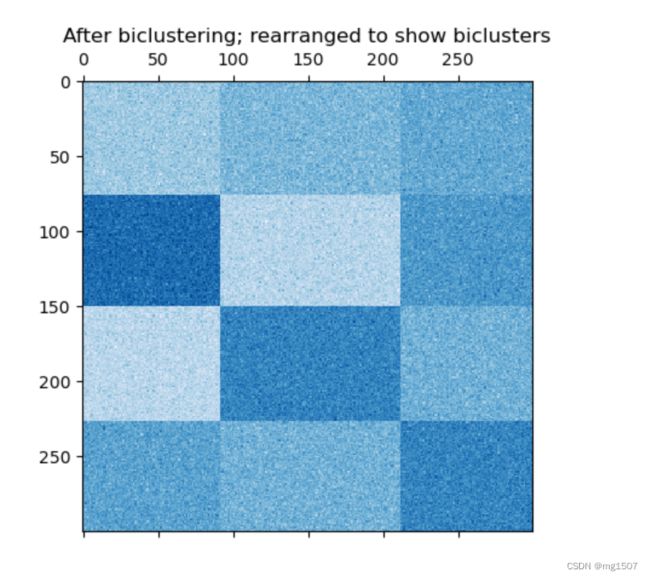
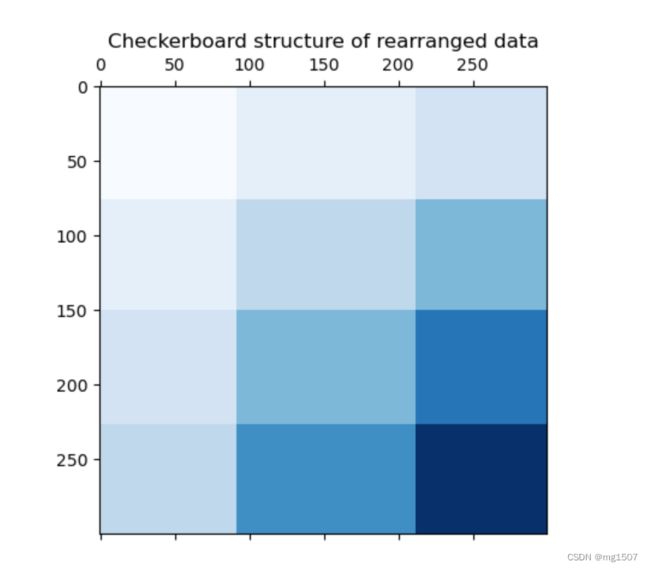
最后给个双聚类的例子来说明什么是双聚类,双聚类就是对行和列都进行聚类。
# Author: Kemal Eren 
活动地址:CSDN21天学习挑战赛