【python学习】-matplotlib绘制双坐标柱状图
matplotlib绘制双坐标柱状图
-
- 单坐标柱状图绘制
- 双坐标柱状图绘制
-
- 图形美化
本文章记录双坐标柱状图的绘制过程
单坐标柱状图绘制
#来自官网的例子
import matplotlib.pyplot as plt
import numpy as np
#柱状图两组数值
men_means = [20, 34, 30, 35, 27]
women_means = [25, 32, 34, 20, 25]
#设置x轴
x = np.arange(5)  # the label locations
width = 0.35  # the width of the bars,设置柱状图柱子的大小
#绘图
fig, ax = plt.subplots()
rects1 = ax.bar(x - width/2, men_means, width, label='Men')
rects2 = ax.bar(x + width/2, women_means, width, label='Women')
#设置坐标轴标签
# Add some text for labels, title and custom x-axis tick labels, etc.
ax.set_ylabel('Scores')
ax.set_xlabel('Course')
ax.legend()#显示图例
#图形自动调整位置
fig.tight_layout()
#显示图形
plt.show()
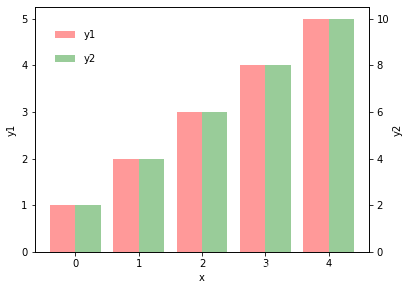
双坐标柱状图绘制
import matplotlib.pyplot as plt
import numpy as np
fig=plt.figure(figsize=(6,4.5))
ax1 = fig.add_subplot(111)
x = np.arange(5)   # 横坐标范围
total_width, n = 0.8, 2   # 柱状图总宽度,有两组数据
width = total_width / n   # 单个柱状图的宽度
x1 = x - width / 2   # 第一组数据柱状图横坐标起始位置
x2 = x1 + width   # 第二组数据柱状图横坐标起始位置
y1=[1,2,3,4,5]
y2=[2,4,6,8,10]
#第一幅
ax1.bar(x1,y1,width=width,label='y1',color='red',alpha=0.4)
ax1.legend(frameon=False,loc=(0.05,0.85))
ax1.set_xlabel('x')
ax1.set_ylabel('y1')
#第二幅
ax2 = ax1.twinx()
ax2.bar(x2,y2,width=width,label='y2',color='green',alpha=0.4)
ax2.legend(frameon=False,loc=(0.05,0.75))
ax2.set_xlabel('x')
ax2.set_ylabel('y2')
#图形显示
plt.show()
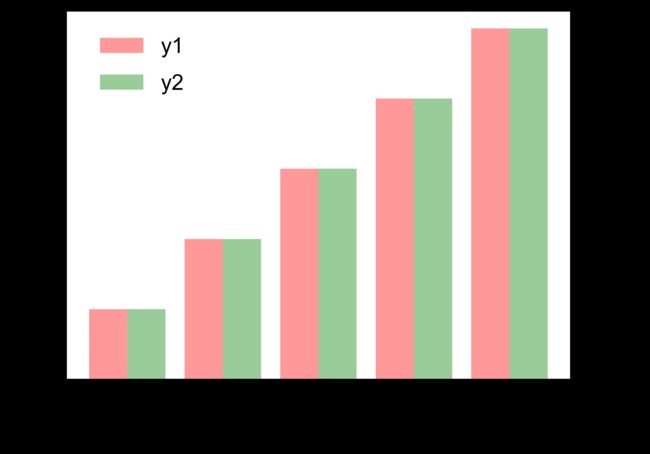
图形美化
import matplotlib.pyplot as plt
import numpy as np
#图形大小、像素、字体设置
fig=plt.figure(figsize=(6,4.5))
plt.rcParams['figure.figsize']=(6,4.5)
plt.rcParams['savefig.dpi'] = 600 #图片像素
plt.rcParams['figure.dpi'] = 600
plt.rcParams['font.sans-serif']=['Arial']#图形字体
#字体类型,大小设置
font1 = {'family' : 'Arial',
         'weight' : 'normal',
         'size'   : 18,}
#绘图设置
ax1 = fig.add_subplot(111)
x = np.arange(5)   # 横坐标范围
total_width, n = 0.8, 2   # 柱状图总宽度,有两组数据
width = total_width / n   # 单个柱状图的宽度
x1 = x - width / 2   # 第一组数据柱状图横坐标起始位置
x2 = x1 + width   # 第二组数据柱状图横坐标起始位置
y1=[1,2,3,4,5]
y2=[2,4,6,8,10]
#第一幅
ax1.bar(x1,y1,width=width,label='y1',color='red',alpha=0.4)
plt.legend(frameon=False,loc=(0.05,0.85),fontsize='x-large')
ax1.set_xlabel('x',font1)
ax1.set_ylabel('y1',font1)
plt.yticks(fontsize=16)
plt.xticks(fontsize=16)#调整刻度数值显示角度
#第二幅
ax2 = ax1.twinx()
ax2.bar(x2,y2,width=width,label='y2',color='green',alpha=0.4)
plt.legend(frameon=False,loc=(0.05,0.75),fontsize='x-large')
ax2.set_xlabel('x',font1)
ax2.set_ylabel('y2',font1)
plt.yticks(fontsize=16)
plt.xticks(fontsize=16)#调整刻度数值显示角度
#图形显示
plt.show()


