机器学习绘制决策边界
一、绘制等高线图:
np.meshgrid 得到笛卡尔积 的xy二维坐标值 并返回二个通道,x通道数据,y通道数据
coutourf 不同高度面填充颜色
coutour 不同高度面不填充颜色
import numpy as np
import sklearn
import matplotlib.pyplot as plt
fig, (ax1, ax2) = plt.subplots(2)
x = np.arange(-5, 5, 0.1)
y = np.arange(-5, 5, 0.1)
xx, yy = np.meshgrid(x, y)  # 生成网格点的横坐标xx与纵坐标yy
z = np.sin(xx**2 + yy**2) / (xx**2 + yy**2)  # 三维中的高度值
ax1.contourf(xx, yy, z) #不同高度面填充颜色
ax2.contour(xx, yy, z)  # 与contourf区别在于不同高度面不填充颜色
plt.show()
二、对于等高线图和网格点的理解:
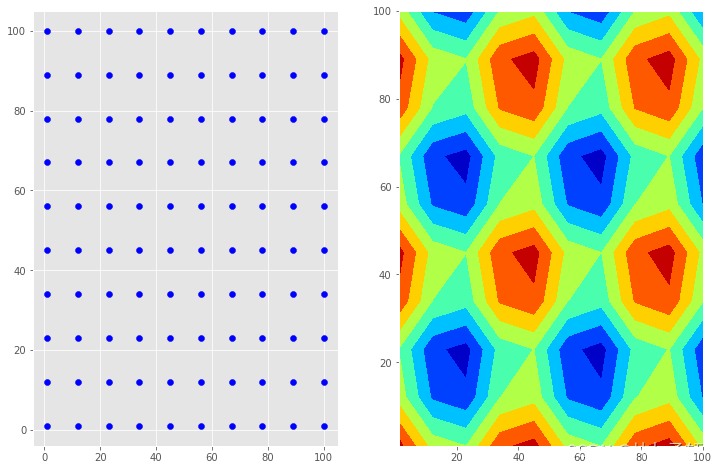
等高线图实质上是三维图在二维平面上的映射,而网格点就是x,y轴所形成的平面上的点,由于z轴是基于二维上的,即指二维平面,而整个平面可以看成密密麻麻的网格点堆在一起形成的。
可通过np.meshgrid(x,y)函数生成网格点坐标,函数返回网格点的横坐标和纵坐标的两个数组
x = np.linspace(1,100,10)
y = np.linspace(1,100,10)

xx,yy = np.meshgrid(x, y)
zz = np.sin(xx)+np.sin(yy)#笛卡尔积
fig, ax = plt.subplots(figsize=(12,8),ncols=2,nrows=1)#该方法会返回画图对象  和坐标对象ax
ax[0].scatter(xx,yy,c= 'b')
ax[1].scatter(xx,yy,c= 'r')
ax[1].contourf(xx, yy, zz)
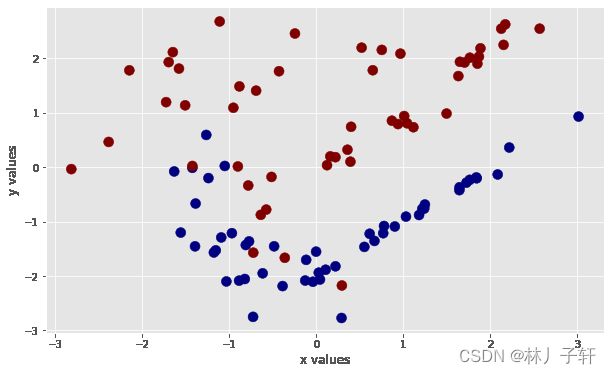
from sklearn import datasets
X, y = datasets.make_classification(n_samples=100, n_features=2,
                                    n_redundant=0, n_classes=2,
                                    random_state=7816)
X.shape, y.shape
((100, 2), (100,))
import matplotlib.pyplot as plt
plt.style.use('ggplot')
plt.set_cmap('jet')
%matplotlib inline
plt.figure(figsize=(10, 6))
plt.scatter(X[:, 0], X[:, 1], c=y, s=100)
plt.xlabel('x values')
plt.ylabel('y values')
Text(0, 0.5, 'y values')
import numpy as np
X = X.astype(np.float32)
y = y * 2 - 1
from sklearn import model_selection as ms
X_train, X_test, y_train, y_test = ms.train_test_split(
    X, y, test_size=0.2, random_state=42
)
X_train,X_test
(array([[-0.61702013, -1.9507395 ],
        [ 1.6450748 , -0.4222899 ],
        [ 1.7640094 , -0.23332804],
        [ 1.2486835 , -0.686556  ],
        [ 1.6334159 ,  1.6738582 ],
        [ 1.2183704 , -0.7669169 ],
        [ 0.16054986,  0.19849268],
        [-0.1278565 , -2.0840392 ],
        [ 0.12317213,  0.0359357 ],
        [-0.9709195 , -1.2135282 ],
        [-0.11676288, -1.703719  ],
        [ 0.0280838 , -1.9391911 ],
        [-0.81110406, -1.4310402 ],
        [ 0.22020994, -1.8222455 ],
        [ 2.1726243 ,  2.6239777 ],
        [ 0.66845876, -1.3559657 ],
        [-1.2406462 , -0.20070334],
        [ 1.6471438 , -0.36924782],
        [ 1.24068   , -0.76143456],
        [ 0.61339664, -1.2242023 ],
        [-1.0935117 , -1.2921417 ],
        [ 0.10722372, -1.8851807 ],
        [-1.4251138 ,  0.02189843],
        [ 1.8441168 , -0.20444912],
        [-1.11126   ,  2.6774619 ],
        [-0.78300637, -0.33697492],
        [-0.7272081 , -2.7513132 ],
        [ 1.1816319 , -0.8792529 ],
        [-0.4852377 , -1.4548061 ],
        [ 0.2940306 , -2.1749008 ],
        [ 1.8874915 ,  2.183879  ],
        [-1.5794848 ,  1.8115468 ],
        [ 2.1531518 ,  2.2471972 ],
        [ 0.76921976, -1.2139444 ],
        [-0.95387596,  1.0913609 ],
        [ 2.218722  ,  0.36066234],
        [ 1.6513894 ,  1.9364004 ],
        [ 1.7048137 ,  1.9225718 ],
        [ 3.0159166 ,  0.92949766],
        [ 0.6493559 ,  1.7809987 ],
        [-1.3882953 , -0.6683605 ],
        [ 1.0308963 , -0.90877813],
        [ 0.90261936, -1.0907607 ],
        [ 0.39993578,  0.7418135 ],
        [ 1.0104648 ,  0.93917257],
        [ 2.5684457 ,  2.5450635 ],
        [ 1.1164502 ,  0.7338727 ],
        [-0.8226732 , -2.0554278 ],
        [ 0.7787023 , -1.0816369 ],
        [-1.6498985 ,  2.1136792 ],
        [-2.817483  , -0.03595557],
        [-1.5588998 , -1.2025453 ],
        [-0.88811916, -2.0859838 ],
        [ 1.7268511 , -0.2841321 ],
        [ 2.0856595 , -0.13440621],
        [-0.36259544, -1.6655918 ],
        [ 0.5211277 ,  2.1957133 ],
        [-1.1780349 , -1.5681677 ],
        [-0.63837975, -0.8762331 ],
        [-1.0528626 ,  0.02201376],
        [-0.7735381 , -1.3642828 ],
        [-0.72482103, -1.5715724 ],
        [ 0.9671993 ,  2.0858662 ],
        [ 0.3581408 ,  0.32014772],
        [-2.3880033 ,  0.46342805],
        [-1.1562688 , -1.5288647 ],
        [-1.7272867 ,  1.194754  ],
        [ 0.29003623, -2.77185   ],
        [-0.24574374,  2.4558947 ],
        [-0.38786876, -2.1855214 ],
        [-2.1499403 ,  1.7797415 ],
        [ 0.04206933, -2.0647743 ],
        [ 1.0431476 ,  0.80665034],
        [-0.5153609 , -0.1795183 ],
        [ 0.22016343,  0.18310092],
        [-1.697495  ,  1.930459  ],
        [ 0.93875206,  0.79173493],
        [-1.394693  , -1.4552505 ],
        [-1.5084162 ,  1.1365789 ],
        [ 0.39250737,  0.1004171 ]], dtype=float32),
 array([[-0.576044  , -0.7798615 ],
        [ 1.7655052 ,  2.0111153 ],
        [ 1.8523791 ,  1.9018308 ],
        [ 0.8693191 ,  0.85342664],
        [-0.03900883, -2.105599  ],
        [ 1.8700253 ,  2.030998  ],
        [-0.42903137,  1.7630126 ],
        [-1.6343501 , -0.07882959],
        [-0.90215075,  0.01293269],
        [-0.00270996, -1.5528013 ],
        [-1.0342563 , -2.1003609 ],
        [-0.8843563 ,  1.4838971 ],
        [ 0.55252546, -1.4654596 ],
        [-0.69239944,  1.4059073 ],
        [ 2.1265776 ,  2.544739  ],
        [-1.425565  , -0.01257189],
        [-1.2656574 ,  0.5921075 ],
        [ 1.8397864 , -0.18889229],
        [ 0.752963  ,  2.1549072 ],
        [ 1.4976935 ,  0.9849039 ]], dtype=float32))
import cv2
svm = cv2.ml.SVM_create()
svm.setKernel(cv2.ml.SVM_LINEAR)
svm.train(X_train, cv2.ml.ROW_SAMPLE, y_train)
_, y_pred = svm.predict(X_test)

from sklearn import metrics
print(metrics.accuracy_score(y_test, y_pred),_,y_pred.shape)
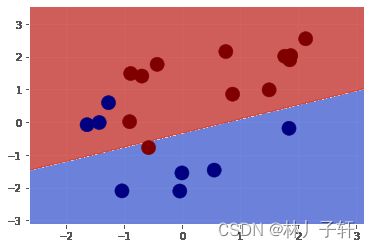
def plot_decision_boundary(svm, X_test, y_test):
    # create a mesh to plot in
    h = 0.02  # step size in mesh
    x_min, x_max = X_test[:, 0].min() - 1, X_test[:, 0].max() + 1
    y_min, y_max = X_test[:, 1].min() - 1, X_test[:, 1].max() + 1
    xx, yy = np.meshgrid(np.arange(x_min, x_max, h),
                         np.arange(y_min, y_max, h))

    X_hypo = np.c_[xx.ravel().astype(np.float32),
                   yy.ravel().astype(np.float32)]
    _, zz = svm.predict(X_hypo)
    print(xx.shape,X_hypo.shape,zz.shape)
    zz = zz.reshape(xx.shape)

    plt.contourf(xx, yy, zz, cmap=plt.cm.coolwarm, alpha=0.8)
    plt.scatter(X_test[:, 0], X_test[:, 1], c=y_test, s=200)

plot_decision_boundary(svm,X_test,y_test)
0.8 0.0 (20, 1)
(333, 289) (96237, 2) (96237, 1)


