Python机器学习笔记:异常点检测算法——LOF(Local Outiler Factor)
![]()
人工智能学习离不开实践的验证,推荐大家可以多在FlyAI-AI竞赛服务平台多参加训练和竞赛,以此来提升自己的能力。FlyAI是为AI开发者提供数据竞赛并支持GPU离线训练的一站式服务平台。每周免费提供项目开源算法样例,支持算法能力变现以及快速的迭代算法模型。
完整代码及其数据,请移步小编的GitHub
传送门:请点击我
如果点击有误:https://github.com/LeBron-Jian/MachineLearningNote
在数据挖掘方面,经常需要在做特征工程和模型训练之前对数据进行清洗,剔除无效数据和异常数据。异常检测也是数据挖掘的一个方向,用于反作弊,伪基站,金融欺诈等领域。
在之前已经学习了异常检测算法One Class SVM和 isolation Forest算法,博文如下:
Python机器学习笔记:异常点检测算法——One Class SVM
Python机器学习笔记:异常点检测算法——Isolation Forest
下面学习一个新的异常检测算法:Local Outlier Factor
前言:异常检测算法
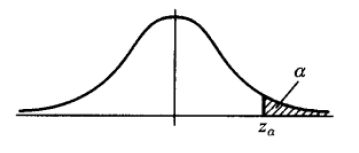
异常检测方法,针对不同的数据形式,有不同的实现方法。常用的有基于分布的方法,在上下 α 分位点之外的值认为是异常值(例如下图),对于属性值常用此类方法。基于距离的方法,适用于二维或高维坐标体系内异常点的判别。例如二维平面坐标或经纬度空间坐标下异常点识别,可用此类方法。
下面要学习一种基于距离的异常检测算法,局部异常因子 LOF算法(Local Outlier Factor)。此算法可以在中等高维数据集上执行异常值检测。
Local Outlier Factor(LOF)是基于密度的经典算法(Breuning et,al 2000),文章发表与SIGMOD 2000 ,到目前已经有 3000+引用。在LOF之前的异常检测算法大多数是基于统计方法的,或者是借用了一些聚类算法用于异常点的识别(比如:DBSCAN,OPTICS),但是基于统计的异常检测算法通常需要假设数据服从特定的概率分布,这个假设往往是不成立的。而聚类的方法通常只能给出0/1的判断(即:是不是异常点),不能量化每个数据点的异常程度。相比较而言,基于密度的LOF算法要更简单,直观。它不需要对数据的分布做太多要求,还能量化每个数据点的异常程度(outlierness)。
在学习LOF之前,可能需要了解一下KMeans算法,这里附上博文:
Python机器学习笔记:K-Means算法,DBSCAN算法
1,LOF(Local Outlier Factor)算法理论
(此处地址:https://blog.csdn.net/wangyibo0201/article/details/51705966/)
1.1 LOF算法介绍
LOF是基于密度的算法,其最核心的部分是关于数据点密度的刻画。如果对 distanced-based 或者 density-based 的聚类算法有些印象,你会发现 LOF中用来定义密度的一些概念和K-Means算法一些概念很相似。
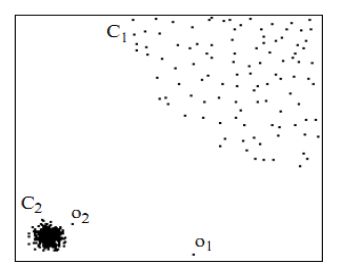
首先用视觉直观的感受一下,如下图,对于C1集合的点,整体间距,密度,分散情况较为均匀一致。可以认为是同一簇;对于C2集合点,同样可认为是一簇。o1, o2点相对孤立,可以认为是异常点或离散点。现在的问题是,如何实现算法的通用性,可以满足C1 和 C2 这种密度分散情况迥异的集合的异常点识别。LOF可以实现我们的目标,LOF不会因为数据密度分散情况不同而错误的将正确点判定为异常点。
1.2 LOF 算法步骤
下面介绍 LOF算法的相关定义:
(1) d(p, o) :两点 P 和 O 之间的距离
(2) K-distance:第 k 距离
在距离数据点 p 最近的 几个点中,第 k 个最近的点跟点 p 之间的距离称为点 p的K-邻近距离,记为 K-distance(p)。
对于点 p 的第 k 距离 dk(p) 定义如下:
dk(p) = d(p, o) 并且满足:
(a)在集合中至少有不包括 p 在内的 k 个点 o∈ C{x≠p},满足d(p,o') ≤ d(p,o)
(b)在集合中最多不包括 p 在内的 k-1 个点 o∈ C{x≠p},满足d(p,o') ≤ d(p,o)
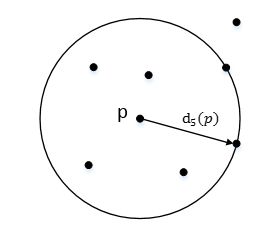
p 的第 k 距离,也就是距离 p 第 k 远的点的距离,不包括 P,如下图所示:
(3) k-distance neighborhood of p:第 k 距离邻域
点 p 的第 k 距离邻域 Nk(p) 就是 p 的第 k距离即以内的所有点,包括第 k 距离。
因此 p 的 第 k 邻域点的个数 |Nk(p)| >=k
(4) reach-distance:可达距离
可达距离(Reachablity distance):可达距离的定义跟K-邻近距离是相关的,给定参数k时,数据点 p 到 数据点o的可达距离 reach-dist(p, o)为数据点 o 的 K-邻近距离和数据点 p与点o 之间的直接距离的最大值。
点 o 到 点 p 的第 k 可达距离定义为:
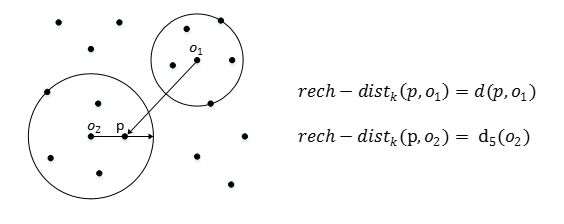
![]() 也就是,点 o 到点 p 的第 k 可达距离,至少是 o 的第 k 距离,或者为 o, p之间的真实距离。这也意味着,离点 o 最近的 k 个点, o 到他们的可达距离被认为是相等,且都等于 dk(o)。如下图所示, o1 到 p 的第 5 可达距离为 d(p, o1),o2 到 p 的第5可达距离为 d5(o2)
也就是,点 o 到点 p 的第 k 可达距离,至少是 o 的第 k 距离,或者为 o, p之间的真实距离。这也意味着,离点 o 最近的 k 个点, o 到他们的可达距离被认为是相等,且都等于 dk(o)。如下图所示, o1 到 p 的第 5 可达距离为 d(p, o1),o2 到 p 的第5可达距离为 d5(o2)
(5) local reachablity density:局部可达密度
局部可达密度(local reachablity density):局部可达密度的定义是基于可达距离的,对于数据点 p,那些跟 点 p的距离小于等于 K-distance(p) 的数据点称为它的 K-nearest-neighbor,记为Nk(p),数据点p的局部可达密度为它与邻近的数据点的平均可达距离的导数。
点 p 的局部可达密度表示为:
表示点 p 的第 k 邻域内点到 p 的平均可达距离的倒数。
注意:是 p 的邻域点 Nk(p)到 p的可达距离,不是 p 到 Nk(p) 的可达距离,一定要弄清楚关系。并且,如果有重复点,那么分母的可达距离之和有可能为0,则会导致 ird 变为无限大,下面还会继续提到这一点。
这个值的含义可以这样理解,首先这代表一个密度,密度越高,我们认为越可能属于同一簇,密度越低,越可能是离群点,如果 p 和 周围邻域点是同一簇,那么可达距离越可能为较小的 dk(o),导致可达距离之和较小,密度值较高;如果 p 和周围邻居点较远,那么可达距离可能都会取较大值 d(p, o),导致密度较小,越可能是离群点。
(6) local outlier factor:局部离群因子
Local Outlier Factor:根据局部可达密度的定义,如果一个数据点根其他点比较疏远的话,那么显然它的局部可达密度就小。但LOF算法衡量一个数据点的异常程度,并不是看他的绝对局部密度,而是它看跟周围邻近的数据点的相对密度。这样做的好处是可以允许数据分布不均匀,密度不同的情况。局部异常因子既是用局部相对密度来定义的。数据点 p 的局部相对密度(局部异常因子)为点 p 的邻居们的平均局部可达密度跟数据点 p 的局部可达密度的比值。
点 p 的局部离群因子表示为:
 表示点 p 的邻域点 Nk(p) 的局部可达密度与点 p的局部可达密度之比的平均数。
LOF 主要通过计算一个数值 score 来反映一个样本的异常程度。这个数值的大致意思是:一个样本点周围的样本点所处位置的平均密度比上该样本点所在位置的密度。如果这个比值越接近1,说明 p 的其邻域点密度差不多, p 可能和邻域同属一簇;如果这个比值越小于1,说明 p 的密度高于其邻域点目睹,p 为密度点;如果这个比值越大于1,说明 p 的密度小于其邻域点密度, p 越可能是异常点。
所以了解了上面LOF一大堆定义,我们在这里简单整理一下此算法:
- 1,对于每个数据点,计算它与其他所有点的距离,并按从近到远排序
- 2,对于每个数据点,找到它的K-Nearest-Neighbor,计算LOF得分
1.3 算法应用
LOF 算法中关于局部可达密度的定义其实暗含了一个假设,即:不存在大于等于k个重复的点。当这样的重复点存在的时候,这些点的平均可达距离为零,局部可达密度就变为无穷大,会给计算带来一些麻烦。在实际应用中,为了避免这样的情况出现,可以把 K-distance改为 K-distinct-distance,不考虑重复的情况。或者,还可以考虑给可达距离都加一个很小的值,避免可达距离等于零。
LOF算法需要计算数据点两两之间的距离,造成整个算法时间复杂度为 O(n**2)。为了提高算法效率,后续有算法尝试改进。FastLOF(Goldstein, 2012)先将整个数据随机的分成多个子集,然后在每个子集里计算 LOF值。对于那些LOF异常得分小于等于1的。从数据集里剔除,剩下的在下一轮寻找更合适的 nearest-neighbor,并更新LOF值。这种先将数据粗略分为多个部分,然后根据局部计算结果将数据过滤减少计算量的想法,并不罕见。比如,为了改进 K-Means的计算效率,Canopy Clustering算法也采用过比较相似的做法。
2,LOF算法应用(sklearn实现)
2.1 sklearn 中LOF库介绍
Unsupervised Outlier Detection using Local Outlier Factor (LOF)。
The anomaly score of each sample is called Local Outlier Factor. It measures the local deviation of density of a given sample with respect to its neighbors. It is local in that the anomaly score depends on how isolated the object is with respect to the surrounding neighborhood. More precisely, locality is given by k-nearest neighbors, whose distance is used to estimate the local density. By comparing the local density of a sample to the local densityes of its neighbors, one can identify samples that have s substantially lower density than their neighbors. These are considered outliers.
局部离群点因子为每个样本的异常分数,主要是通过比较每个点 p 和其邻域点的密度来判断该点是否为异常点,如果点p的密度越低,越可能被认定是异常点。至于密度,是通过点之间的距离计算的,点之间的距离越远,密度越低,距离越近,密度越高。而且,因为LOF对密度的是通过点的第 k 邻域来计算,而不是全局计算,因此得名 “局部”异常因子。
Sklearn中LOF在 neighbors 里面,其源码如下:
LOF的中主要参数含义:
- n_neighbors:设置k,default=20
- contamination:设置样本中异常点的比例,default=auto
LOF的主要属性:
补充一下这里的 negative_outlier_factor_:和LOF相反的值,值越小,越有可能是异常值。(LOF的值越接近1,越有可能是正常样本,LOF的值越大于1,则越有可能是异常样本)
LOF的主要方法:
2.2 LOF算法实战
实例1:在一组数中找异常点
代码如下:
import numpy as np
from sklearn.neighbors import LocalOutlierFactor as LOF

X = [[-1.1], [0.2], [100.1], [0.3]]
clf = LOF(n_neighbors=2)
res = clf.fit_predict(X)
print(res)
print(clf.negative_outlier_factor_)

'''
如果 X = [[-1.1], [0.2], [100.1], [0.3]]
[ 1  1 -1  1]
[ -0.98214286  -1.03703704 -72.64219576  -0.98214286]

如果 X = [[-1.1], [0.2], [0.1], [0.3]]
[-1  1  1  1]
[-7.29166666 -1.33333333 -0.875      -0.875     ]

如果 X = [[0.15], [0.2], [0.1], [0.3]]
[ 1  1  1 -1]
[-1.33333333 -0.875      -0.875      -1.45833333]
'''
我们可以发现,随着数字的改变,它的异常点也在变,无论怎么变,都是基于邻域密度比来衡量。
实例2:Outlier detection
(outlier detection:当训练数据中包含离群点,模型训练时要匹配训练数据的中心样本,忽视训练样本的其他异常点)
The Local Outlier Factor(LOF) algorithm is an unsupervised anomaly detection method which computes the local density deviation of a given data point with respect to its neighbors. It considers as outliers the samples that have a substantially lower density than their neighbors.
This example shows how to use LOF for outlier detection which is the default use case of this estimator in sklearn。Note that when LOF is used for outlier detection it has no predict, decision_function and score_samples methods.
The number of neighbors considered(parameter n_neighbors)is typically set 1) greater than the minimum number of samples a cluster has to contain, so that other samples can be local outliers relative to this cluster , and 2) smaller than the maximum number of close by samples that can potentially be local outliers. In practice, such informations are generally not available and taking n_neighbors=20 appears to work well in general.
邻居的数量考虑(参数 n_neighbors通常设置为:
- 1) 大于一个集群包含最小数量的样本,以便其他样本可以局部离群
- 2) 小于附加的最大数量样本,可以局部离群值
在实践中,这种信息一般是不可用的,n_neighbors=20 似乎实践很好。
代码:
#_*_coding:utf-8_*_
import numpy as np
from sklearn.neighbors import LocalOutlierFactor as LOF
import matplotlib.pyplot as plt

# generate train data
X_inliers = 0.3 * np.random.randn(100, 2)
X_inliers = np.r_[X_inliers + 2, X_inliers - 2]


# generate some outliers
X_outliers = np.random.uniform(low=-4, high=4, size=(20, 2))
X = np.r_[X_inliers, X_outliers]

n_outliers = len(X_outliers)  # 20
ground_truth = np.ones(len(X), dtype=int)
ground_truth[-n_outliers:] = -1

# fit the model for outlier detection
clf = LOF(n_neighbors=20, contamination=0.1)

# use fit_predict to compute the predicted labels of the training samples
y_pred = clf.fit_predict(X)
n_errors = (y_pred != ground_truth).sum()
X_scores = clf.negative_outlier_factor_


plt.title('Locla Outlier Factor (LOF)')
plt.scatter(X[:, 0], X[:, 1], color='k', s=3., label='Data points')
# plot circles with radius proportional to thr outlier scores
radius = (X_scores.max() - X_scores) / (X_scores.max() - X_scores.min())
plt.scatter(X[:, 0], X[:, 1], s=1000*radius, edgecolors='r',
    facecolors='none', label='Outlier scores')
plt.axis('tight')
plt.xlim((-5, 5))
plt.ylim((-5, 5))
plt.xlabel("prediction errors: %d"%(n_errors))
legend = plt.legend(loc='upper left')
legend.legendHandles[0]._sizes = [10]
legend.legendHandles[1]._sizes = [20]
plt.show()
结果如下:
这个图可能有点复杂。这样我们将异常点设置为2个,则执行效果:
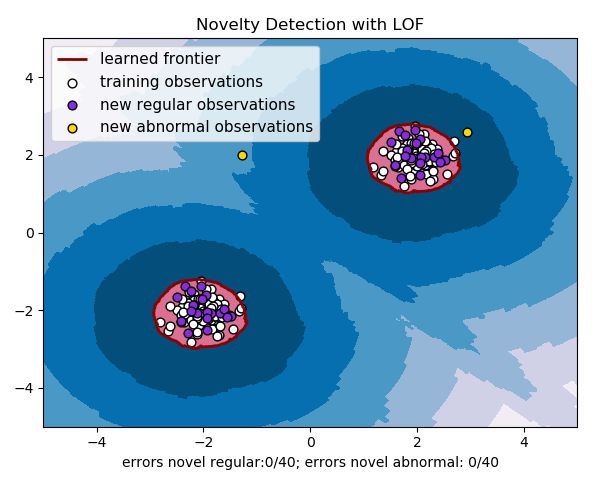
实例3:Novelty detection
(novelty detection:当训练数据中没有离群点,我们的目的是用训练好的模型去检测另外发现的新样本。)
The Local Outlier Factor(LOF) algorithm is an unsupervised anomaly detection method which computes the local density deviation of a given data point with respect to its neighbors. It considers as outliers the samples that have a substantially lower density than their neighbors.
This example shows how to use LOF for novelty detection .Note that when LOF is used for novelty detection you MUST not use no predict, decision_function and score_samples on the training set as this would lead to wrong result. you must only use these methods on new unseen data(which are not in the training set)
The number of neighbors considered(parameter n_neighbors)is typically set 1) greater than the minimum number of samples a cluster has to contain, so that other samples can be local outliers relative to this cluster , and 2) smaller than the maximum number of close by samples that can potentially be local outliers. In practice, such informations are generally not available and taking n_neighbors=20 appears to work well in general.
代码如下:
#_*_coding:utf-8_*_
import numpy as np
from sklearn.neighbors import LocalOutlierFactor as LOF
import matplotlib.pyplot as plt
import matplotlib


# np.meshgrid() 生成网格坐标点
xx, yy = np.meshgrid(np.linspace(-5, 5, 500), np.linspace(-5, 5, 500))

# generate normal  (not abnormal) training observations
X = 0.3*np.random.randn(100, 2)
X_train = np.r_[X+2, X-2]

# generate new normal (not abnormal) observations
X = 0.3*np.random.randn(20, 2)
X_test = np.r_[X+2, X-2]

# generate some abnormal novel observations
X_outliers = np.random.uniform(low=-4, high=4, size=(20, 2))


# fit the model for novelty detection  (novelty=True)
clf = LOF(n_neighbors=20, contamination=0.1, novelty=True)
clf.fit(X_train)

# do not use predict, decision_function and score_samples on X_train
# as this would give wrong results but only on new unseen data(not
# used in X_train , eg: X_test, X_outliers or the meshgrid)
y_pred_test = clf.predict(X_test)
y_pred_outliers = clf.predict(X_outliers)
'''
### contamination=0.1
X_test: [ 1  1  1  1  1  1  1  1  1  1  1  1  1  1 -1  1  1 -1  1  1  1  1  1  1
  1  1  1  1  1  1  1  1  1  1 -1  1  1 -1  1  1]

### contamination=0.01
X_test: [1 1 1 1 1 1 1 1 1 1 1 1 1 1 1 1 1 1 1 1 1 1 1 1 1 1 1 1 1 1 1 1 1 1 1 1 1
 1 1 1]

y_pred_outliers: [-1 -1 -1 -1 -1 -1 -1 -1 -1 -1 -1 -1 -1 -1 -1 -1 -1 -1 -1 -1]
'''

n_error_test = y_pred_test[y_pred_test == -1].size
n_error_outliers = y_pred_outliers[y_pred_outliers == 1].size

# plot the learned frontier, the points, and the nearest vectors to the plane
Z = clf.decision_function(np.c_[xx.ravel(), yy.ravel()])
Z = Z.reshape(xx.shape)

plt.title('Novelty Detection with LOF')
plt.contourf(xx, yy, Z, levels=np.linspace(Z.min(), 0, 7), cmap=plt.cm.PuBu)
a = plt.contour(xx, yy, Z, levels=[0], linewidths=2, colors='darkred')
plt.contourf(xx, yy, Z, levels=[0, Z.max()], colors='palevioletred')

s = 40
b1 = plt.scatter(X_train[:, 0], X_train[:, 1], c='white', s=s, edgecolors='k')
b2 = plt.scatter(X_test[:, 0], X_test[:, 1], c='blueviolet', s=s, edgecolors='k')

c = plt.scatter(X_outliers[:, 0], X_outliers[:, 1], c='gold', s=s, edgecolors='k')

plt.axis('tight')
plt.xlim((-5, 5))
plt.ylim((-5, 5))
plt.legend([a.collections[0], b1, b2, c],
            ["learned frontier", "training observations",
            "new regular observations", "new abnormal observations"],
            loc='upper left',
            prop=matplotlib.font_manager.FontProperties(size=11))

plt.xlabel("errors novel regular:%d/40; errors novel abnormal: %d/40"
    %(n_error_test, n_error_outliers))
plt.show()
效果如下:
对上面模型进行调参,并设置异常点个数为2个,则效果如下:
参考地址:
https://scikit-learn.org/stable/modules/generated/sklearn.neighbors.LocalOutlierFactor.html?highlight=lof
https://blog.csdn.net/YE1215172385/article/details/79766906
https://blog.csdn.net/bbbeoy/article/details/80301211
![]()
更多精彩内容请访问FlyAI-AI竞赛服务平台;为AI开发者提供数据竞赛并支持GPU离线训练的一站式服务平台;每周免费提供项目开源算法样例,支持算法能力变现以及快速的迭代算法模型。
挑战者,都在FlyAI!!!
