Kaggle系列(3)- Telco Customer Churn
文章目录
- 0x01、简介
- 0x02、数据探索
-
- 2.1 文件信息总览
- 2.2 数据处理
-
- 2.2.1 数据分布
- 2.2.2 数值型数据处理
- 2.3 数据关系探索
-
- 2.3.1 入网时间与留存的关系
- 2.3.2 消费金额与流失的关系
- 2.3.3 服务及人口学特征与流失的关系
- 2.3.4 人口学特征对各服务用户流失的影响
- 2.4 数据探索的结论
- 0x03、预处理
-
- 3.1 数据类型转换
- 3.2 数据集分离
- 0x04、模型训练
- 0x05、模型调优
- 0x06、总结
- 参考资料
电信用户流失分析与预测,涉及到模型选择与参数调优。
0x01、简介
这是来自IBM的样本数据集,记录了用户订购的服务、账户信息及人口学特征。希望通过预测用户行为来留住用户,可以分析所有相关的用户数据,开发出有针对性的留存方法。
每一行代表一个用户,每一列包括了用户的属性。数据集包括以下信息:
- Churn:表示在最后一个月流失的用户。
- 每个用户注册的服务,包括:phone(电话服务), multiple lines(多条线路), internet(网络服务), online security(在线安全服务), online backup(在线备份服务), device protection(设备防护服务), tech support(技术支持服务), and streaming TV and movies(流TV及电影)。
- 用户账户信息:在网时间,contract(付费周期), payment method(付费方式), paperless billing(无纸化账单), monthly charges(月消费), and total charges(总消费)。
- 用户的人口学特征:gender(性别), age range(年龄范围), and if they have partners and dependents(是否有伴侣及子女)。
Kaggle上的解释不是很完整,在参考资料2中,给出了更多的用户信息及其解释,结合这份数据,每个字段的解释如下:
| 字段名称 | 说明 |
|---|---|
| customerID | 用户的唯一标识 |
| gender | 性别 |
| SeniorCitizen | 是否65岁以上老人 |
| Partner | 是否有伴侣 |
| Dependents | 是否有被抚养人(孩子、父母等) |
| tenure | 入网月数 |
| PhoneService | 订购家庭电话服务 |
| MultipleLines | 订购多条电话线路 |
| InternetService | 订购网络服务 |
| OnlineSecurity | 订购附加的在线安全服务 |
| OnlineBackup | 订购附加的在线备份服务 |
| DeviceProtection | 为公司提供的网络设备购买附加的设备保护服务 |
| TechSupport | 订购附加的技术支持以缩短等待时间 |
| StreamingTV | 使用第三方的流TV(不额外收费) |
| StreamingMovies | 使用第三方的流电影(不额外收费) |
| Contract | 当前合约类型 |
| PaperlessBilling | 是否使用无纸化账单 |
| PaymentMethod | 付款方式 |
| MonthlyCharges | 当前的包含所有服务的月总费用 |
| TotalCharges | 入网至今的总费用 |
| Churn | 是否流失 |
0x02、数据探索
2.1 文件信息总览
读取文件,可以看到:
- 共有7043行,21列数据;
- 大部分字段都是 object 类型,应该是字符串格式的;
- 内存占用7.8MB,对于这个数据量来说是挺大的,后面可能需要优化。
import pandas as pd
import numpy as np
import time

df = pd.read_csv('WA_Fn-UseC_-Telco-Customer-Churn.csv')
df.info(memory_usage='deep')  # deep参数可以显示准确的内存占用


########## 结果 ##########
<class 'pandas.core.frame.DataFrame'>
RangeIndex: 7043 entries, 0 to 7042
Data columns (total 21 columns):
 #   Column            Non-Null Count  Dtype
---  ------            --------------  -----
 0   customerID        7043 non-null   object
 1   gender            7043 non-null   object
 2   SeniorCitizen     7043 non-null   int64
 3   Partner           7043 non-null   object
 4   Dependents        7043 non-null   object
 5   tenure            7043 non-null   int64
 6   PhoneService      7043 non-null   object
 7   MultipleLines     7043 non-null   object
 8   InternetService   7043 non-null   object
 9   OnlineSecurity    7043 non-null   object
 10  OnlineBackup      7043 non-null   object
 11  DeviceProtection  7043 non-null   object
 12  TechSupport       7043 non-null   object
 13  StreamingTV       7043 non-null   object
 14  StreamingMovies   7043 non-null   object
 15  Contract          7043 non-null   object
 16  PaperlessBilling  7043 non-null   object
 17  PaymentMethod     7043 non-null   object
 18  MonthlyCharges    7043 non-null   float64
 19  TotalCharges      7043 non-null   object
 20  Churn             7043 non-null   object
dtypes: float64(1), int64(2), object(18)
memory usage: 7.8 MB
看一下具体的数据,形成总体印象:
df.head()


########## 结果 ##########
customerID	gender	SeniorCitizen	Partner	Dependents	tenure	PhoneService	MultipleLines	InternetService	OnlineSecurity	...	DeviceProtection	TechSupport	StreamingTV	StreamingMovies	Contract	PaperlessBilling	PaymentMethod	MonthlyCharges	TotalCharges	Churn
0	7590-VHVEG	Female	0	Yes	No	1	No	No phone service	DSL	No	...	No	No	No	No	Month-to-month	Yes	Electronic check	29.85	29.85	No
1	5575-GNVDE	Male	0	No	No	34	Yes	No	DSL	Yes	...	Yes	No	No	No	One year	No	Mailed check	56.95	1889.5	No
2	3668-QPYBK	Male	0	No	No	2	Yes	No	DSL	Yes	...	No	No	No	No	Month-to-month	Yes	Mailed check	53.85	108.15	Yes
3	7795-CFOCW	Male	0	No	No	45	No	No phone service	DSL	Yes	...	Yes	Yes	No	No	One year	No	Bank transfer (automatic)	42.30	1840.75	No
4	9237-HQITU	Female	0	No	No	2	Yes	No	Fiber optic	No	...	No	No	No	No	Month-to-month	Yes	Electronic check	70.70	151.65	Yes
5 rows × 21 columns
2.2 数据处理
2.2.1 数据分布
1、看一下各个字段唯一值的个数
可以看到,除了 [‘customerID’,‘tenure’,‘MonthlyCharges’,‘TotalCharges’] 这四个字段外的其他字段均只有2~3个唯一值,那么可以分别统计一下唯一值的分布。
# 看一下 有多少个不同的值
print(df.agg({pd.Series.nunique}))


########## 总结 ##########
         customerID  gender  SeniorCitizen  Partner  Dependents  tenure  \
nunique        7043       2              2        2           2      73

         PhoneService  MultipleLines  InternetService  OnlineSecurity  ...  \
nunique             2              3                3               3  ...

         DeviceProtection  TechSupport  StreamingTV  StreamingMovies  \
nunique                 3            3            3                3

         Contract  PaperlessBilling  PaymentMethod  MonthlyCharges  \
nunique         3                 2              4            1585

         TotalCharges  Churn
nunique          6531      2

[1 rows x 21 columns]
2、各值的分布
# 看一下数据分布
col_number = ['customerID','tenure','MonthlyCharges','TotalCharges']

for col in df.columns.values:
    if col not in col_number:
        print('列名: {}\n{}\n{}\n'.format(col, '-'*20, df[col].value_counts()))


########## 结果 ##########
列名: gender
--------------------
Male      3555
Female    3488
Name: gender, dtype: int64

列名: SeniorCitizen
--------------------
0    5901
1    1142
Name: SeniorCitizen, dtype: int64

列名: Partner
--------------------
No     3641
Yes    3402
Name: Partner, dtype: int64

列名: Dependents
--------------------
No     4933
Yes    2110
Name: Dependents, dtype: int64

列名: PhoneService
--------------------
Yes    6361
No      682
Name: PhoneService, dtype: int64

列名: MultipleLines
--------------------
No                  3390
Yes                 2971
No phone service     682
Name: MultipleLines, dtype: int64

列名: InternetService
--------------------
Fiber optic    3096
DSL            2421
No             1526
Name: InternetService, dtype: int64

列名: OnlineSecurity
--------------------
No                     3498
Yes                    2019
No internet service    1526
Name: OnlineSecurity, dtype: int64

列名: OnlineBackup
--------------------
No                     3088
Yes                    2429
No internet service    1526
Name: OnlineBackup, dtype: int64

列名: DeviceProtection
--------------------
No                     3095
Yes                    2422
No internet service    1526
Name: DeviceProtection, dtype: int64

列名: TechSupport
--------------------
No                     3473
Yes                    2044
No internet service    1526
Name: TechSupport, dtype: int64

列名: StreamingTV
--------------------
No                     2810
Yes                    2707
No internet service    1526
Name: StreamingTV, dtype: int64

列名: StreamingMovies
--------------------
No                     2785
Yes                    2732
No internet service    1526
Name: StreamingMovies, dtype: int64

列名: Contract
--------------------
Month-to-month    3875
Two year          1695
One year          1473
Name: Contract, dtype: int64

列名: PaperlessBilling
--------------------
Yes    4171
No     2872
Name: PaperlessBilling, dtype: int64

列名: PaymentMethod
--------------------
Electronic check             2365
Mailed check                 1612
Bank transfer (automatic)    1544
Credit card (automatic)      1522
Name: PaymentMethod, dtype: int64

列名: Churn
--------------------
No     5174
Yes    1869
Name: Churn, dtype: int64
也可以把统计数据都合并到一张表中:
tmp_unique = pd.DataFrame(columns=['sub_value', 'sub_num', 'column_name'])

for cc in df.columns.values:
    if cc not in col_number:
        tmp_df = df.groupby(cc, as_index=False).agg({'customerID':pd.Series.nunique})
        tmp_df['column_name'] = cc
        tmp_df.columns = ['sub_value','sub_num', 'column_name']
        tmp_unique = pd.concat([tmp_unique, tmp_df], axis=0)

tmp_unique = tmp_unique[['column_name','sub_value','sub_num']]
print(tmp_unique)


########## 结果 ##########
        column_name                  sub_value sub_num
0            gender                     Female    3488
1            gender                       Male    3555
0     SeniorCitizen                          0    5901
1     SeniorCitizen                          1    1142
0           Partner                         No    3641
1           Partner                        Yes    3402
0        Dependents                         No    4933
1        Dependents                        Yes    2110
0      PhoneService                         No     682
1      PhoneService                        Yes    6361
0     MultipleLines                         No    3390
1     MultipleLines           No phone service     682
2     MultipleLines                        Yes    2971
0   InternetService                        DSL    2421
1   InternetService                Fiber optic    3096
2   InternetService                         No    1526
0    OnlineSecurity                         No    3498
1    OnlineSecurity        No internet service    1526
2    OnlineSecurity                        Yes    2019
0      OnlineBackup                         No    3088
1      OnlineBackup        No internet service    1526
2      OnlineBackup                        Yes    2429
0  DeviceProtection                         No    3095
1  DeviceProtection        No internet service    1526
2  DeviceProtection                        Yes    2422
0       TechSupport                         No    3473
1       TechSupport        No internet service    1526
2       TechSupport                        Yes    2044
0       StreamingTV                         No    2810
1       StreamingTV        No internet service    1526
2       StreamingTV                        Yes    2707
0   StreamingMovies                         No    2785
1   StreamingMovies        No internet service    1526
2   StreamingMovies                        Yes    2732
0          Contract             Month-to-month    3875
1          Contract                   One year    1473
2          Contract                   Two year    1695
0  PaperlessBilling                         No    2872
1  PaperlessBilling                        Yes    4171
0     PaymentMethod  Bank transfer (automatic)    1544
1     PaymentMethod    Credit card (automatic)    1522
2     PaymentMethod           Electronic check    2365
3     PaymentMethod               Mailed check    1612
0             Churn                         No    5174
1             Churn                        Yes    1869
综合以上数据概览情况,可以知道如下的字段信息:
| 字段名称 | 字段类型 | 说明 | 枚举值 |
|---|---|---|---|
| customerID | object | 用户的唯一标识 | |
| gender | object | 性别 | Male,Female |
| SeniorCitizen | int64 | 是否65岁以上老人 | 1,0 |
| Partner | object | 是否有伴侣 | Yes,No |
| Dependents | object | 是否有被抚养人(孩子、父母等) | Yes,No |
| tenure | int64 | 入网月数 | |
| PhoneService | object | 订购家庭电话服务 | Yes,No |
| MultipleLines | object | 订购多条电话线路 | Yes,No |
| InternetService | object | 订购网络服务 | Fiber optic,DSL,No |
| OnlineSecurity | object | 订购附加的在线安全服务 | Yes,No,No internet service |
| OnlineBackup | object | 订购附加的在线备份服务 | Yes,No,No internet service |
| DeviceProtection | object | 为公司提供的网络设备购买附加的设备保护服务 | Yes,No,No internet service |
| TechSupport | object | 订购附加的技术支持以缩短等待时间 | Yes,No,No internet service |
| StreamingTV | object | 是否使用第三方的流TV(不额外收费) | Yes,No,No internet service |
| StreamingMovies | object | 是否使用第三方的流电影(不额外收费) | Yes,No,No internet service |
| Contract | object | 当前合约类型 | Month-to-month,One Year,Two Year |
| PaperlessBilling | object | 是否使用无纸化账单 | Yes,No |
| PaymentMethod | object | 用户付款方式 | Electronic check,Bank transfer (automatic),Credit card (automatic),Mailed check |
| MonthlyCharges | float64 | 当前的包含所有服务的月总费用 | |
| TotalCharges | object | 入网至今的总费用 | |
| Churn | object | 是否流失 | Yes,No |
2.2.2 数值型数据处理
TotalCharges 为总消费金额,应将其转换为数值型。但 object 类型转换成 float 类型不能使用 astype(),应该使用 pd.to_numeric() 方法。转换后发现有空值,于是查看一下空值的情况,发现空值都是当月刚入网的用户,应该是还没有产生费用,所以可以将空值置为0。
# 把 TotalCharges 转成数值型 (str类型不能用 astype 转成 float)
df['TotalCharges'] = pd.to_numeric(df['TotalCharges'], errors='coerce')

# 查看是否有空值
print(df['TotalCharges'].isnull().sum())

# 有11行的 TotalCharges 为空,猜测这是指新入网用户还没产生费用? tenure 指的是入网周期
df.loc[df['TotalCharges'].isnull(), ['customerID','tenure','MonthlyCharges','TotalCharges','Churn']]

# 将空值置为0
df['TotalCharges'].fillna(0, inplace=True)


########## 结果 ##########
11

customerID	tenure	MonthlyCharges	TotalCharges	Churn
488	4472-LVYGI	0	52.55	NaN	No
753	3115-CZMZD	0	20.25	NaN	No
936	5709-LVOEQ	0	80.85	NaN	No
1082	4367-NUYAO	0	25.75	NaN	No
1340	1371-DWPAZ	0	56.05	NaN	No
3331	7644-OMVMY	0	19.85	NaN	No
3826	3213-VVOLG	0	25.35	NaN	No
4380	2520-SGTTA	0	20.00	NaN	No
5218	2923-ARZLG	0	19.70	NaN	No
6670	4075-WKNIU	0	73.35	NaN	No
6754	2775-SEFEE	0	61.90	NaN	No
现在可以看一下数据的范围,以便使用较小的数据类型(节省内存)。tenure 可以设置为 int8,其他两个可以设置为 float32。
df[['tenure','MonthlyCharges','TotalCharges']].agg({np.max, np.min, np.mean, pd.Series.std})


########## 结果 ##########

        tenure	MonthlyCharges	TotalCharges
amin	0.000000	18.250000	0.000000
std	24.559481	30.090047	2266.794470
amax	72.000000	118.750000	8684.800000
mean	32.371149	64.761692	2279.734304
2.3 数据关系探索
可以将特征分为三类:服务类(service)、人口学特征(demographic)和 账户信息(account),可以分别从以上几个方面与流失的关系进行分析。
service = ['PhoneService','MultipleLines','InternetService',
           'OnlineSecurity','DeviceProtection','TechSupport',
           'StreamingTV','StreamingMovies',
           'Contract','PaperlessBilling','PaymentMethod']
demographic = ['gender','SeniorCitizen','Partner','Dependents']
account = ['customerID','tenure','MonthlyCharges','TotalCharges','Churn']
2.3.1 入网时间与留存的关系
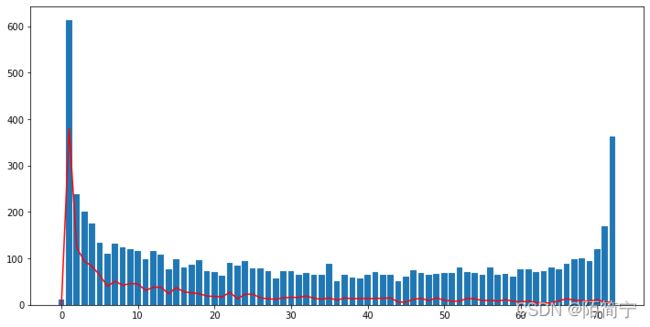
tenure 有 73 个唯一值,比较少,因此可以把每个值对应的总用户数、流失用户数都列出来,观察趋势。由结果图可以看到,流失曲线基本正常,在 0~6 个月流失曲线很陡,流失率较大;20个月之后逐渐稳定下来。
# 查看入网情况
tmp_df = df.groupby('tenure', as_index=False).agg({'customerID':pd.Series.count})
tmp_df.columns = ['tenure','cnts']

tmp_df2 = df[df['Churn'] == 'Yes'].groupby('tenure', as_index=False).agg({'customerID':pd.Series.count})
tmp_df2.columns = ['tenure','churn_yes']

tmp_df3 = df[df['Churn'] == 'No'].groupby('tenure', as_index=False).agg({'customerID':pd.Series.count})
tmp_df3.columns = ['tenure','churn_no']

tmp_df = tmp_df.merge(tmp_df2, on='tenure', how='left').merge(tmp_df3, on='tenure', how='left')
tmp_df.fillna(0, inplace=True)

# 绘图
s_name = list(tmp_df['tenure'])
s_value1 = list(tmp_df['cnts'])
s_value2 = list(tmp_df['churn_yes'])
s_value3 = list(tmp_df['churn_no'])

from matplotlib import pyplot as plt
fig = plt.figure(figsize=(12,6), facecolor='w')
plt.bar(s_name, s_value1)
plt.plot(s_name, s_value2,'r-')
plt.show()
2.3.2 消费金额与流失的关系
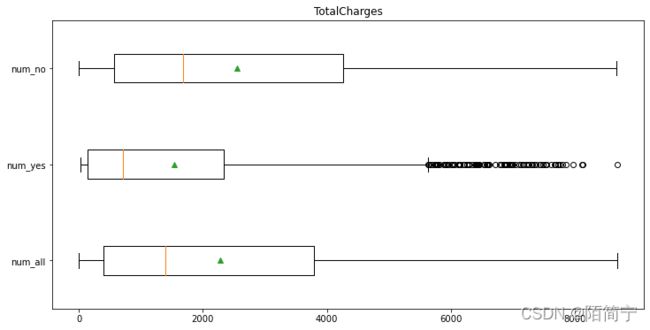
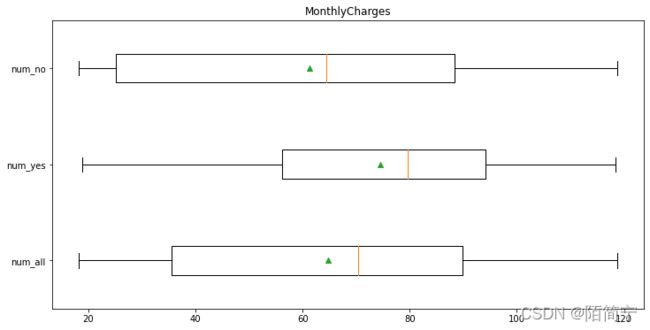
使用箱线图,分别观察流失用户的消费分布:
- 流失用户的总体消费金额比留存用户的低很多,与整体用户相比也处于较低的水平;
- 流失用户的月消费金额则相对较大,且金额相对比较集中。
## MonthlyCharges 和 TotalCharges 与流失的关系
account_info = ['customerID','tenure','MonthlyCharges','TotalCharges','Churn']

def box_out(col):
    s_value1 = list(df[col])
    s_value2 = list(df.loc[(df['Churn'] == 'Yes'), col])
    s_value3 = list(df.loc[(df['Churn'] == 'No'), col])
    labels = ['num_all','num_yes','num_no']

    from matplotlib import pyplot as plt
    fig = plt.figure(figsize=(12,6), facecolor='w')
    plt.boxplot([s_value1, s_value2, s_value3], labels=labels, vert=False, showmeans=True)
    plt.title(col)

    plt.savefig('figure\\{}_box.png'.format(col), bbox_inches = 'tight', pad_inches = 0.1)
    exe_text('{}_box.png out'.format(col))

box_out('TotalCharges')
box_out('MonthlyCharges')
2.3.3 服务及人口学特征与流失的关系
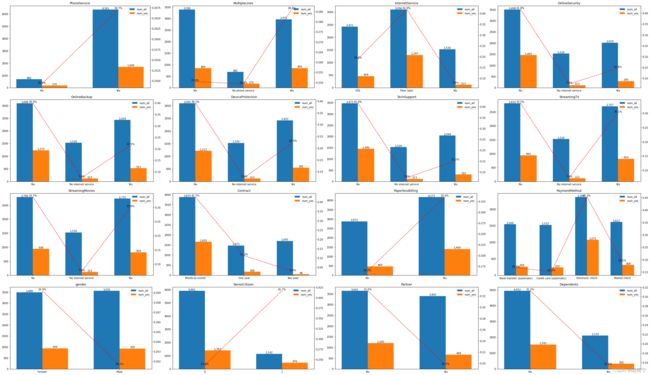
取总的用户数和流失用户数,并计算流失率。因为要画图的项目太多了,所以就把它们生成png图片,放到同一个文件夹下保存起来。
先列出流失率较大的项目:
- 流失率差别不大的服务:PhoneSerivce(电话服务)、MultipleLines(多线路)、StreamingTV、StreamingMoives(流媒体服务,无论是否订购,流失率都差不多);
- 服务类流失率较大的项目:
- 光纤用户(InterneiService:Fbier optic,41.9%);
- 未订购在线安全服务(OnlineSecurity:No,41.8%);
- 未订购在线备份服务(OnlineBackup:No,39.9%);
- 未订购设备防护服务(DeviceProtection:No,39.1%);
- 未订购技术支持服务(TechSupport:No,41.6%);
- 费用类流失率较大的项目:
- 每月付费用户(Contract:Month-to-month,42.7%);
- 无纸化账单用户(PaperlessBilling:Yes,33.6%);
- 电子支票付费用户(PaymentMethod:Electronic check,45.3%);
- 人口学特征中流失率较大的特征:
- 老年用户(SeniorCitizen:1,41.7%);
- 无子女用户(Partner:No,33.0%);
- 无父母用户(Dependents:No,31.3%);
可以看出:光纤用户流失较大;没有订购附加服务(安全、备份、防护、技术支持)的用户流失率较大;每月付费和电子支付用户流失率高;老年用户流失率高。其中,月付费用户、没有订购附加服务的用户流失率高是比较正常的。而光纤用户、老年用户、电子支票支付用户流失率高就需要再详细分析一下。
# 服务及人口学特征与流失的关系
def fig_out(col):
    tmp_df = df.groupby(col, as_index=False)['customerID'].count()
    tmp_df.columns =[col,'num_all']

    tmp_df2 = df[df['Churn'] == 'Yes'].groupby(col, as_index=False)['customerID'].count()
    tmp_df2.columns = [col,'num_yes']

    tmp_df = tmp_df.merge(tmp_df2, on=col, how='left')
    tmp_df.loc[:,['num_all','num_yes']].fillna(0, inplace=True)
    tmp_df.loc[:,'churn_yes'] = tmp_df[['num_yes','num_all']].apply(lambda x: (x['num_yes'] / x['num_all']), axis=1)
    #print(tmp_df)

    s_name = list(tmp_df[col])
    s_name2 = np.arange(len(s_name))
    s_value1 = list(tmp_df['num_all'])
    s_value2 = list(tmp_df['num_yes'])
    s_value3 = list(tmp_df['churn_yes'])

    # 条形图中 条的宽度
    wids = len(s_name) / (len(s_name) * 3)

    # 绘图
    from matplotlib import pyplot as plt
    fig, ax1 = plt.subplots(figsize=(10,6), facecolor='w')
    ax2 = ax1.twinx()

    ax1.bar(s_name2 - (wids/2), s_value1, width=wids, label='num_all')
    ax1.bar(s_name2 + (wids/2), s_value2, width=wids, label='num_yes')
    ax2.plot(s_name2, s_value3, color='r', linestyle='--', label='churn_yes')

    # 数据标签
    for a,b,c,d in zip(s_name2, s_value1, s_value2, s_value3):
        ax1.text(a - (wids/2), b, '{:,}'.format(b), ha='center', va='bottom', fontsize=10)
        ax1.text(a + (wids/2), c, '{:,}'.format(c), ha='center', va='bottom', fontsize=10)
        ax2.text(a, d, '{:.1%}'.format(d), ha='center', va='bottom', fontsize=10)

    ax1.legend()
    plt.title(col)
    plt.xticks(s_name2, s_name)
    #plt.legend(loc='upper right')
    plt.savefig('figure\\{}.png'.format(col), bbox_inches = 'tight', pad_inches = 0.1)
    #plt.show()
    exe_text('{}.png: out'.format(col))


for cc in service:
    fig_out(cc)

for cc in demographic:
    fig_out(cc)
以上代码共生成了16张图片,一张一张贴出来太麻烦了,所以将它们合并为一张大图:
# 将之前的图片合并为一张图
from PIL import Image

features = service + demographic
print(features)

def figs_union():
    # 读取图片
    img_list = [Image.open('figure\\{}.png'.format(i)) for i in features]
    # 把图片调整成同一尺寸(防止图片尺寸有微小不同)
    imgs = []
    for i in img_list:
        new_img = i.resize((647,373), Image.BILINEAR)
        imgs.append(new_img)
    # 获取图片的宽度、高度
    width, height = imgs[0].size
    # 创建空白大图(4 x 4)
    result = Image.new(imgs[0].mode, (width * 4, height * 4))
    # 拼接图片
    for i, im in enumerate(imgs):
        result.paste(im, box=((i % 4) * width, (i // 4) * height))
    # 保存图片
    result.save('features.png')

figs_union()
2.3.4 人口学特征对各服务用户流失的影响
- 性别对于服务的影响并不明显。
- 老年人流失率较高的项目:
- 光纤用户,47.3%;
- 没有订购在线安全、在线备份、设备保护、技术支持的,约50%;
- 按月付费,54.6%;
- 无纸化账单,45.4%;
- 电子支票,53.4%;
- 无伴侣用户流失率较高的项目:
- 光纤用户,49.7%;
- 没有订购在线安全、在线备份、设备保护、技术支持的,约45%;
- 按月付费,44.7%;
- 无纸化账单,40.9%;
- 付费方式-电子支票,50.8%;
- 无子女流失率较高的项目:
- 光纤用户,45%;
- 没有订购在线安全、在线备份、设备保护、技术支持的,约44%;
- 按月付费,45.2%;
- 无纸化账单,38.2%;
- 付费方式-电子支票,48.6%;
综合上述分析,可以知道:光纤服务,没有订购在线安全、在线备份、设备保护、技术支持等服务,预付费用户,使用无纸化账单,电子支票付费的用户,流失率较高。
#### 维度间关系:性别、老人、伴侣、孩子 X 服务
def figure_mix(col1, col2):
    tmp_df1 = df.groupby([col1,col2], as_index=False).agg({'customerID':pd.Series.nunique})
    tmp_df2 = df.loc[df['Churn'] == 'Yes',[col1,col2,'customerID']]\
                .groupby([col1,col2], as_index=False).agg({'customerID':pd.Series.nunique})
    tmp_df1.columns = [col1,col2,'num_all']
    tmp_df2.columns = [col1,col2,'num_yes']
    # 整合数据
    tmp_df = tmp_df1.merge(tmp_df2, on=[col1,col2], how='left')
    tmp_df.loc[:,'churn_yes'] = tmp_df[['num_all','num_yes']].apply(lambda x: (x['num_yes'] / x['num_all']), axis=1)
    # 打印结果
    print('{} X {}:\n{}\n{}\n'.format(col1, col2, '-'*20, tmp_df))

service = ['PhoneService','MultipleLines','InternetService',
           'OnlineSecurity','OnlineBackup','DeviceProtection','TechSupport',
           'StreamingTV','StreamingMovies',
           'Contract','PaperlessBilling','PaymentMethod']
demographic = ['gender','SeniorCitizen','Partner','Dependents']

for dd in demographic:
    for ss in service:
        figure_mix(dd,ss)


########## 结果 ##########
# 结果太长就不贴了
2.4 数据探索的结论
- 光纤服务本来应该网速较快,且比 DSL 方便,但流失率较高,应检查光纤服务是否存在问题。
- 大部分老年人订购了电话服务、多线路服务、按月付费、无纸化账单和电子支票付费,而没有订购在线安全、在线备份、设备保护和技术支持。
- 电子支票本应该提高效率,但流失率较高,所以也可以找找此项业务是否存才缺陷。
- 没有订购在线安全、在线备份、设备保护和技术支持的用户流失率较高,而老年用户尤其高,可将这四种服务组合起来向老年用户推广。
0x03、预处理
3.1 数据类型转换
1、需要转换数据类型
- TotalCharges:前面已经由 object 类型转换为了 float64 类型;
- SinorCitizen:只有0,1两个值,可以转换为 category 类型;
- customerID:无需转换类型;
- 其他 ojbect 类型:可以转换为 category 类型,以节省内存空间;
# 将 一些数据类型转换为 category
service = ['PhoneService','MultipleLines','InternetService',
           'OnlineSecurity','OnlineBackup','DeviceProtection','TechSupport',
           'StreamingTV','StreamingMovies',
           'Contract','PaperlessBilling','PaymentMethod']
demographic = ['gender','SeniorCitizen','Partner','Dependents']
account = ['customerID','tenure','MonthlyCharges','TotalCharges','Churn']

df[service] = df[service].astype('category')
df[demographic] = df[demographic].astype('category')
df['Churn'] = df['Churn'].astype('category')

df.info(memory_usage='deep')


########## 结果 ##########
<class 'pandas.core.frame.DataFrame'>
RangeIndex: 7043 entries, 0 to 7042
Data columns (total 21 columns):
 #   Column            Non-Null Count  Dtype
---  ------            --------------  -----
 0   customerID        7043 non-null   object
 1   gender            7043 non-null   category
 2   SeniorCitizen     7043 non-null   category
 3   Partner           7043 non-null   category
 4   Dependents        7043 non-null   category
 5   tenure            7043 non-null   int64
 6   PhoneService      7043 non-null   category
 7   MultipleLines     7043 non-null   category
 8   InternetService   7043 non-null   category
 9   OnlineSecurity    7043 non-null   category
 10  OnlineBackup      7043 non-null   category
 11  DeviceProtection  7043 non-null   category
 12  TechSupport       7043 non-null   category
 13  StreamingTV       7043 non-null   category
 14  StreamingMovies   7043 non-null   category
 15  Contract          7043 non-null   category
 16  PaperlessBilling  7043 non-null   category
 17  PaymentMethod     7043 non-null   category
 18  MonthlyCharges    7043 non-null   float64
 19  TotalCharges      7043 non-null   float64
 20  Churn             7043 non-null   category
dtypes: category(17), float64(2), int64(1), object(1)
memory usage: 747.1 KB
2、编码转换
- category 类型可以转换为整数形式。
- 使用 OrdinalEncoder 转换后为float64,可以再次转换为 int8。
# 预处理:将 类别 编码转换为0-1的形式
# OneHorEncoder: 将类别特征转码为 one-hot 数列。
# LabelEncoder: 将 标签y 转换为 (0 ~ 类别数-1 )的区间。
# OrdinalEncoder: 将类别特征转码为整数数列。
from sklearn.preprocessing import LabelEncoder, OrdinalEncoder

# 取 category 类型的字段
category_list = df_data.select_dtypes('category').columns.to_list()

# 转换后字段类型为 float64
df_data[category_list] = OrdinalEncoder().fit_transform(df[category_list])

# 转换为int类型
df_data[category_list] = df_data[category_list].astype('int8')
3.2 数据集分离
# 分离训练集与测试集
from sklearn.model_selection import train_test_split

set_y = df_data['Churn']
set_X = df_data.drop(['customerID','Churn'], axis=1)

train_X, test_X, train_y, test_y = train_test_split(set_X, set_y, test_size=0.2)  # 注意四个数据集的顺序

print('shape:\ntrain_X: {}, test_X: {}'.format(train_X.shape, test_X.shape))


########## 结果 ##########
shape:
train_X: (5634, 19), test_X: (1409, 19)
0x04、模型训练
# 算法模型
from sklearn.linear_model import LogisticRegression
from sklearn.tree import DecisionTreeClassifier
from sklearn.ensemble import RandomForestClassifier, GradientBoostingClassifier

from sklearn.model_selection import cross_val_score
from sklearn.metrics import accuracy_score, recall_score, precision_score, f1_score


# 模型训练与比较
def models_train(train_X, train_y, test_X, test_y):
    model_name, train_score = [], []
    pred_accuracy, pred_recall, pred_precision, pred_f1 = [], [], [], []

    for name, model in models:
        # 训练集交叉验证分, 5折交叉验证取均值,用以观察哪个模型在训练集上的表现好
        s_train = cross_val_score(model, train_X, train_y, cv=5).mean()

        # 构建和预测
        model.fit(train_X, train_y)
        pred_y = model.predict(test_X)

        s_accuracy = accuracy_score(pred_y, test_y)
        s_recall = recall_score(pred_y, test_y)
        s_precision = precision_score(pred_y, test_y)
        s_f1 = f1_score(pred_y, test_y)

        # 结果存储
        model_name.append(name)
        train_score.append(s_train)
        pred_accuracy.append(s_accuracy)
        pred_recall.append(s_recall)
        pred_precision.append(s_precision)
        pred_f1.append(s_f1)
        print('[{}] 完成model: {}'.format(time.strftime('%y-%m-%d %H:%M:%S',time.localtime()), name))

    # 合并结果
    models_score = pd.DataFrame({'ModelName':model_name, 'TrainScore':train_score, 'Accuracy':pred_accuracy,\
                                'Recall':pred_recall, 'Precision':pred_precision, 'F1':pred_f1})
    return models_score


# 定义模型及其参数
models = [('LR', LogisticRegression()),
          ('CART', DecisionTreeClassifier()),
          ('RF', RandomForestClassifier()),
          ('GBDT', GradientBoostingClassifier())]

# 训练模型,显示结果
model_score = models_train(train_X, train_y, test_X, test_y)
print(model_score)


########## 结果 ##########
  ModelName  TrainScore  Accuracy    Recall  Precision        F1
0        LR    0.804046  0.778566  0.634831   0.553922  0.591623
1      CART    0.740327  0.735273  0.542579   0.546569  0.544567
2        RF    0.792689  0.785664  0.663580   0.526961  0.587432
3      GBDT    0.804402  0.782115  0.654434   0.524510  0.582313
0x05、模型调优
- 使用贝叶斯调优方法,对GBDT模型调优
# 超参数 贝叶斯调优 (pip3 intall scikit-optimize)
# API Reference: https://scikit-optimize.github.io/stable/modules/classes.html
from skopt import BayesSearchCV
from skopt.space import Real, Categorical, Integer

# 对GBDT调优
gbdt_optm = BayesSearchCV(estimator=GradientBoostingClassifier(),
                          search_spaces={'learning_rate':(0.01,0.1),
                                         'min_samples_split': Integer(2, 30),
                                         'min_samples_leaf':Integer(1,30),
                                         'max_features': Integer(4, 19),
                                         'max_depth': Integer(5, 50),
                                         'subsample':(0.5,1),
                                         'n_estimators': Integer(10, 400)
                                        },
                          cv=5,
                          verbose=-1,
                          n_jobs=-1 )

gbdt_optm.fit(train_X, train_y)

pred_gbdt = gbdt_optm.best_estimator_.predict(test_X)
print(f1_score(pred_gbdt, test_y))
print('-'*20)
print('Best params:\n{}'.format(gbdt_optm.best_params_))


########## 结果 ##########
0.5978428351309707
--------------------
Best params:
OrderedDict([('learning_rate', 0.01), ('max_depth', 3), ('max_features', 19), ('min_samples_leaf', 30), ('min_samples_split', 30), ('n_estimators', 400), ('subsample', 0.5)])
0x06、总结
1、数据分析与服务改进
这是一个二分类问题,特征个数不多而且大多数都是二值的特征,比较利于分类问题。通过流失率的高低,可以判断一项服务是否对流失有显著影响,高流失率的服务可能是存在问题的,可以找出这类服务并结合更具体的数据进行分析。
特征重要性可以表示对流失的影响程度高低。因此可以通过计算重要性来决定优先改进哪一项服务。
2、超参数的调优
第一次接触到参数的调优,这个项目中没有去详细了解其算法细节,后面将详细学习贝叶斯优化的算法。模型选择和参数调优对我来说一直是一个难点,后面还需要继续努力攻克。
3、内存优化
可以看到,一开始 DF 的内存为 7.8MB,改为 category 格式存储 int8 格式存储都是 741KB,占用内存减少了90%。
参考资料
- Telco-Customer-Churn Dataset - Kaggle
- Telco customer churn - IBM
- Kaggle:Telco-Customer churn(电信公司用户流失预测)- 知乎
- Matplotlib - 箱线图、箱型图 boxplot () 所有用法详解 - CSDN
- 十个Kaggle项目带你入门数据分析 - 知乎
- scikit-optimize API Reference - Github
- 4种主流超参数调优技术 - 知乎


