《R in action》《R语言实战》源代码_2
第2章 创建数据集
- 2.1 数据集的概念
- 2.2 数据结构
-
- 2.2.1 向量
- 2.2.2 矩阵
- 2.2.3 数组
- 2.2.4 数据框
- 2.2.5 因子 factor
- 2.2.6 列表
- 2.3 数据输入
-
- 2.3.1 键盘
- 2.3.2 带分隔符的文本文件.txt
- 2.3.3 Excel数据
- 2.3.4 XML
- 2.3.5 网页数据抓取 Webscraping
- 2.3.6 SPSS
- 2.3.7 SAS
- 2.3.8 Stata
- 2.3.9 netCDF
- 2.3.10 HDF5
- 2.3.11 数据库
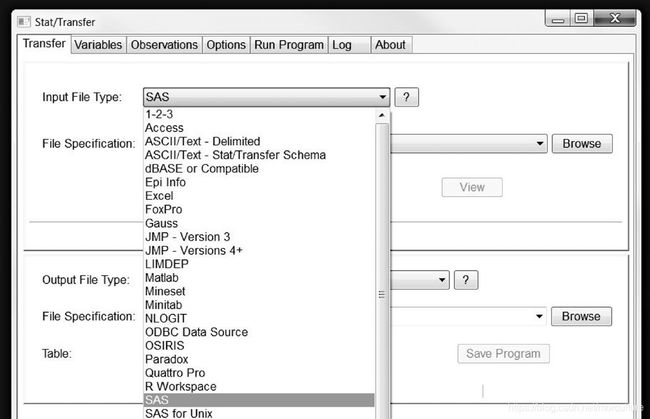
- 2.3.12 Stat/Transfer
- 2.4 数据集的标注
-
- 2.4.1 变量标签
- 2.4.2 值标签
- 2.5 处理数据对象的实用函数 P38-39
2.1 数据集的概念
表2-1 病例数据
| 病人编号(Patient ID) | 入院时间(AdmDate) | 年龄(Age) | 糖尿病类型(Diabetes) | 病情(Status) |
|---|---|---|---|---|
| 1 | 10/15/2009 | 25 | Type1 | Poor |
| 2 | 11/01/2009 | 34 | Type2 | Improved |
| 3 | 10/21/2009 | 28 | Type1 | Excellent |
| 4 | 1-/28/2009 | 52 | Type1 | Poor |
2.2 数据结构
| 维度 | 同质性 | 异质性 |
|---|---|---|
| 一维 | 向量 vector | 列表 list |
| 二维 | 矩阵 matrix | 数据框 data frame |
| N维 | 数组 array |
2.2.1 向量
是用于储存数值型、字符型、逻辑型数据的一维数组。
#创建向量:c()
a <- c(1, 2, 5, 3, 6, -2, 4)
b <- c("one", "two", "three")
c <- c(TRUE, TRUE, TRUE, FALSE, TRUE, FALSE)
#访问向量中的指定元素:[所处位置的数值]
> a <- c(1, 2, 5, 3, 6, -2, 4)
> a[3]
[1] 5
> a[c(1, 3, 5)]
[1] 1 5 6
> a[2:6]
[1] 2 5 3 6 -2
2.2.2 矩阵
是一个二维数组,且每个元素性质同一。
# 创建矩阵:matrix()
# 示例:myymatrix <-matrix(vector, nrow=number_of_row, ncol=number_of_columns,
						 byrow=logical_value, dimnames=list(
						 char_vector_rownames, char_vector_colnames))
- vector:包含了矩阵的元素;
- nrow和ncol:指定行和列的维数;
- dimnames:包含了可选的、 以字符型向量表示的行名和列名;
- byrow(选填):默认=FALSE,即按列填充;=TRUE,即按行填充。
代码清单2-1 创建矩阵
y <- matrix(1:20, nrow = 5, ncol = 4)
y
cells <- c(1, 26, 24, 68)
rnames <- c("R1", "R2")
cnames <- c("C1", "C2")
mymatrix <- matrix(cells, nrow = 2, ncol = 2, byrow = TRUE,
                   dimnames = list(rnames, cnames))
mymatrix
mymatrix <- matrix(cells, nrow = 2, ncol = 2, byrow = FALSE,
                   dimnames = list(rnames, cnames))
mymatrix
> y <- matrix(1:20, nrow = 5, ncol = 4)	#创建一个5×4的矩阵
> y
     [,1] [,2] [,3] [,4]
[1,]    1    6   11   16
[2,]    2    7   12   17
[3,]    3    8   13   18
[4,]    4    9   14   19
[5,]    5   10   15   20

> cells <- c(1, 26, 24, 68)
> rnames <- c("R1", "R2")
> cnames <- c("C1", "C2")
> mymatrix <- matrix(cells, nrow = 2, ncol = 2, byrow = TRUE,
+                    dimnames = list(rnames, cnames))
#创建一个按行填充的、含列名标签的2×2矩阵
> mymatrix
   C1 C2
R1  1 26
R2 24 68
> mymatrix <- matrix(cells, nrow = 2, ncol = 2, byrow = FALSE,
+                    dimnames = list(rnames, cnames))
#创建一个按列填充的、含列名标签的2×2矩阵
> mymatrix
   C1 C2
R1  1 24
R2 26 68
代码清单2-2 矩阵下标的使用
x <- matrix(1:10, nrow = 2)
x
x[2, ]
x[, 2]
x[1, 4]
x[1, c(4, 5)]
> x <- matrix(1:10, nrow = 2)
> x
     [,1] [,2] [,3] [,4] [,5]
[1,]    1    3    5    7    9
[2,]    2    4    6    8   10
> x[2, ]
[1]  2  4  6  8 10
> x[, 2]
[1] 3 4
> x[1, 4]
[1] 7
> x[1, c(4, 5)]
[1] 7 9
2.2.3 数组
类似矩阵,但维度大于矩阵。
# 创建数组:array()
# 示例:myarray <-array(vector, dimension, dimnames)
代码清单2-3 创建一个数组
dim1 <- c("A1", "A2")
dim2 <- c("B1", "B2", "B3")
dim3 <- c("C1", "C2", "C3", "C4")
z <- array(1:24, c(2, 3, 4), dimnames = list(dim1, dim2, dim3))
z
> z
, , C1

   B1 B2 B3
A1  1  3  5
A2  2  4  6

, , C2

   B1 B2 B3
A1  7  9 11
A2  8 10 12

, , C3

   B1 B2 B3
A1 13 15 17
A2 14 16 18

, , C4

   B1 B2 B3
A1 19 21 23
A2 20 22 24

> z[1,2,3]
[1] 15
2.2.4 数据框
==最常用!!!==类似矩阵,但可包含不同格式的数据。
# 创建数组:data.frame()
# 示例:mydata <-data.frame(col1, col2, col3)
代码清单2-4 创建一个数据框
patientID <- c(1, 2, 3, 4)
age <- c(25, 34, 28, 52)
diabetes <- c("Type1", "Type2", "Type1", "Type1")
status <- c("Poor", "Improved", "Excellent", "Poor")
patientdata <- data.frame(patientID, age, diabetes,
    status)
patientdata
> patientdata
  patientID age diabetes    status
1         1  25    Type1      Poor
2         2  34    Type2  Improved
3         3  28    Type1 Excellent
4         4  52    Type1      Poor
代码清单2-5 选取数据框值中的元素
patientdata[1:2]
patientdata[c("diabetes", "status")]
patientdata$age
> patientdata
  patientID age diabetes    status
1         1  25    Type1      Poor
2         2  34    Type2  Improved
3         3  28    Type1 Excellent
4         4  52    Type1      Poor
> patientdata[1:2]
  patientID age
1         1  25
2         2  34
3         3  28
4         4  52
> patientdata[c("diabetes", "status")]
  diabetes    status
1    Type1      Poor
2    Type2  Improved
3    Type1 Excellent
4    Type1      Poor
> patientdata$age
[1] 25 34 28 52
$:用于选取给定数据框中的特定变量;可运用以下函数简化代码:
# 将数据框添加到R的搜索路径中:attach()
# 将数据框从搜索路径中删除:detach()
在使用函数attach()前存在与数据框中相同的对象时,R可能会报错:
#某个对象_已被屏蔽(mask)_
The following object is masked _by_ .GlobalEnv: 	mpg
#应用范围更广的函数:with()
- 仅有一条语句时,{ }可省略
- 赋值:<-仅在函数括弧内生效;特殊赋值符<<-可创建with( )结构外的对象
> with(mtcars,{
+   nokeepstats<-summary(mpg)
+   keepstats<<-summary(mpg)
+   })
> nokeepstats
Error: object 'nokeepstats' not found
> keepstats
   Min. 1st Qu.  Median    Mean 3rd Qu.    Max.
   10.4    15.4    19.2    20.1    22.8    33.9
实例标识符(case identifier):用于区分数据集中不同的个体。如表2-1中的病人编号(Patient ID)。可通过数据框操作函数中的rowname选项指定:
patientdata <- data.frame(patientID, age, diabetes, status, row.names=patientID)
2.2.5 因子 factor
即R中类别/名义型变量、有序/有序型变量的总称。
#以整数向量形式存储类别:factor()
#当类别为有序型变量时:需为factor()制定参数向量order=TRUE
代码清单2-6 因子的使用
patientID <- c(1, 2, 3, 4)
age <- c(25, 34, 28, 52)
diabetes <- c("Type1", "Type2", "Type1", "Type1")
status <- c("Poor", "Improved", "Excellent", "Poor")
diabetes <- factor(diabetes)
status <- factor(status, order = TRUE)
patientdata <- data.frame(patientID, age, diabetes, status)
str(patientdata)	#显示对象结构
summary(patientdata)	#显示对象的统计概要
> str(patientdata)
'data.frame':	4 obs. of  4 variables:
 $ patientID: num  1 2 3 4
 $ age      : num  25 34 28 52
 $ diabetes : Factor w/ 2 levels "Type1","Type2": 1 2 1 1
 $ status   : Ord.factor w/ 3 levels "Excellent"<"Improved"<..: 3 2 1 3
> summary(patientdata)
   patientID         age        diabetes       status
 Min.   :1.00   Min.   :25.0   Type1:3   Excellent:1
 1st Qu.:1.75   1st Qu.:27.2   Type2:1   Improved :1
 Median :2.50   Median :31.0             Poor     :2
 Mean   :2.50   Mean   :34.8
 3rd Qu.:3.25   3rd Qu.:38.5
 Max.   :4.00   Max.   :52.0
2.2.6 列表
代码清单2-7 创建列表
g <- "My First List"
h <- c(25, 26, 18, 39)
j <- matrix(1:10, nrow = 5)
k <- c("one", "two", "three")
mylist <- list(title = g, ages = h, j, k)
mylist
mylist[[2]]
mylist[["ages"]]
> mylist
$title
[1] "My First List"

$ages
[1] 25 26 18 39

[[3]]
     [,1] [,2]
[1,]    1    6
[2,]    2    7
[3,]    3    8
[4,]    4    9
[5,]    5   10

[[4]]
[1] "one"   "two"   "three"

> mylist[[2]]
[1] 25 26 18 39

> mylist[["ages"]]
[1] 25 26 18 39
2.3 数据输入
向R中导入数据的权威指南参见可在 http://cran.r-project.org/doc/manuals/R-data.pdf下载的R Data Import/Export手册
2.3.1 键盘
mydata <- data.frame(age=numeric(0), gender=character(0), weight=numeric(0))
	#age=numeric(0):将创建一个有格式,但为空的变量
mydata <- edit(mydata)
	#edit()必须赋值到一个目标,否则所有修改无效
fix(mydata) #等价写法
2.3.2 带分隔符的文本文件.txt
read.table()
#格式如下:
mydataframe <- read.table(file, header=logical_value,
	sep="delimiter", row.names="names")
- 参数sep默认=" ",即分隔符可以为一或多个空格、制表符(\t)、换行符(\n)、回车符(\r);
- 字符型变量默认情况下转换为factor,当处理某些情况(如被调查者评论)时,可采取以下方法禁止转换:
- 设置选项:stringsAsFactors=FALSE
- 使用colClasses为每个列制定格式:如logical(逻辑型)、numeric(数值型)、character(字符型)、factor(因子)
通过连接(connection)来访问数据的机制:文件名参数
- 函数file():允许用户访问文件、剪贴板和C级别的标准输入。
- 函数gzfile()、bzfile()、xzfile()、unz():允许用户读取压缩文件。
- 函数url():能够让你通过一个含有http://、ftp://或file://的完整URL访问网络上的文件,还可以为HTTP和FTP连接指定代理。为了方便,(用""围住的)完整的URL也经常直接用来代替文件名使用。
- 更多详情,参见help(file)。
2.3.3 Excel数据
- 将EXCEL文件导出为.csv(以逗号分隔文件),用read.table(file)导入;
- 使用函数read.xlsx(file, n):导入.xlsx文件(实质是多个xml文件组成的压缩包)
library(xlsx)
workbook <- "/Users/Documents/myworkbook.xlxs" #“文件路径”
mydataframe <- read.xlxs(workbook, 1)	#1为要导入的表格名称
- Win系统:RODBC包
#安装RODBC包
install.packages("RODBC")
#导入数据
library(RODBC)
channel <- odbcConnectExcel("myfile.xls")
mydataframe <- sqlFetch(channel, "mysheet")
odbcClose(channel)
- channel:是一个由odbcConnectExcel()返回的RODBC连接对象;
- mydataframe是返回的数据框;
- RODBC也可用于从Microsoft Access导入数据。
2.3.4 XML
XML包
2.3.5 网页数据抓取 Webscraping
- 结构简单的网页:先用readLines( )下载网页;后用grep( )/gsub( )处理;
- 结构复杂的网页:用RCurl包、XML包提取
2.3.6 SPSS
- foreign包 -> read.spss()
- Hmisc包 -> spss.get()
install.packages("Hmisc")
mydataframe <- spss.get("mydata.sav", use.value.labels=TRUE)
use.value.labels=TRUE:表示让函数将带有值标签的变量导入为R中水平对应相同的因子
???
2.3.7 SAS
- 旧版本
- foreign包 -> read.ssd()
- Hmisc包 -> sas.get()
- 新版本(9.1或更高)
- 在SAS中用PROC EXPORT储存为.csv格式文件后导入R
#SAS程序:
proc export data = mydata
	 outfile = "mydata.csv"
	 dbms = csv;
run;

#R:
mydata <- read.table("mydata.csv", header=TRUE, sep=" ")
- Stat/Transfer商业软件
2.3.8 Stata
library(foreign)
mydataframe <- read.dta("mydata.dta")
2.3.9 netCDF
- Unidata项目主导的开源软件库netCDF(network Common Data Form,网络通用数据格式)
- 常用领域:地球物理
- ncdf包、ncdf4包(Win不可用,支持netCDF4更早版本)
library(ncdf)
nc <- nc_open("mynetCDFfile")
myarray <- get.var.ncdf(nc, myvar)
2.3.10 HDF5
- HDF5(Hierarchical Data Format,分层数据格式):是一套用于管理超大型和结构极端复杂数 据集的软件技术方案。
- hdf5包
2.3.11 数据库
- ODBC接口
library(RODBC)	#载入了RODBC包
myconn <- odbcConnect("mydsn", uid="Rob", pwd="aardvark")	#通过一个已注册的数据源名称(mydsn)、用户名(rob)、密码(aardvark)打开了一个ODBC数据库连接
crimedat <- sqlFetch(myconn, Crime)		#连接字符串被传递给sqlFetch,它将Crime表复制到R数据框crimedat中
pundat <- sqlQuery(myconn, "select * from Punishment")	#对Punishment表执行SQL语句select并将结果保存到数据框pundat中
close(myconn)	#关闭连接
- DBI相关包
- RJDBC包:使用时请确保安装了针对你的系统和数据库的必要JDBC驱动
- 其他:RMySQL、ROracle、RPostgreSQL、RSQLite(都为对应的数据库提供了原生的数据库驱动,但可能不是在所有系统上都可用)
- 详情请参阅 CRAN(http://cran.r-project.org)上的相应文档
2.3.12 Stat/Transfer
2.4 数据集的标注
类似对变量进行备注
2.4.1 变量标签
name()
names(patientdata)[2] <- "Age at hospitalization (in years)"
#将age重命名为"Age at hospitalization (in years)"
names(patientdata)[2] <- “admissionAge”
#或更为理想的命名,如“admissionAge”
2.4.2 值标签
factor()
patientdata$gender <- factor(patient$gender,
							 levels = c(1,2),
							 labels = c("male", "female"))