基于Matlab模拟偶极子天线设计
✅作者简介:热爱科研的Matlab仿真开发者,修心和技术同步精进,matlab项目合作可私信。
个人主页:Matlab科研工作室
个人信条:格物致知。
更多Matlab仿真内容点击
智能优化算法 神经网络预测 雷达通信 无线传感器
信号处理 图像处理 路径规划 元胞自动机 无人机 电力系统
⛄ 内容介绍
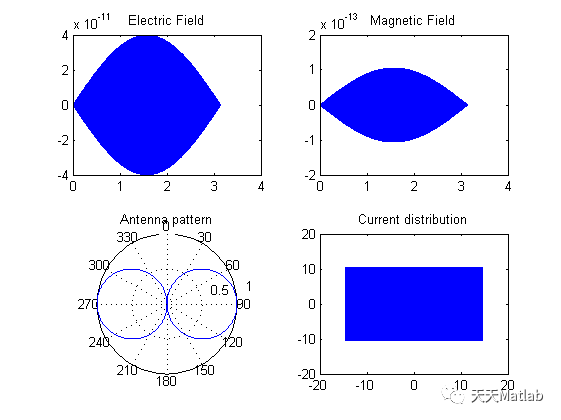
详细阐述了矩量法的数学表述,分别导出双位方程和海伦方程的矩量法数学表达式,并且用点匹配的方法分析矩量法在线天线中的应用.基于双位方程和海伦方程,用MATLAB软件实现了偶极子天线的电流分布、增益、方向图等参数,对不同半径、不同长度的偶极子天线性能进行比较分析,画出结果图,最后得出结论:矩量法分析能够非常接近解析解,说明其正确性.
⛄ 完整代码
clc
clear all
close all hidden
disp('****************************ANTENNA DIPOLE PROJECT******************************')
disp(' farshid.azhir ')
disp('NOTICE!:This project includes 3type of dipole 1)INFINITESIMALE DIPOLE')
disp(' 2)SMALL DIPOLE')
disp(' 3)FINIT LENGHT DIPOLE')
F=input('Please Enter Frequency F(Hz)=\n');
disp('----------------')
lambda=(3e8/F)
disp('----------------')
L=input('Please Enter length L(meter)=\n');
disp('----------------')
I=input('Please Enter Current(Amplitude) I0=');
T=input('Please Enter current(Phase) theta=');
i=I.*exp(j.*T)
disp(' ')
w=2.*pi.*F;
B=2*pi/lambda;
etha=377;
if L<=lambda/50
disp('~~~~~~~~~~~~~~~~~~~~~~~INFINITESIMALE DIPOLE~~~~~~~~~~~~~~~~~~~~~~~~~~~~~~')
r=1000*lambda/(2*pi);
x=0:0.0005:pi;
q=0:0.001:2*pi;
E=(1./(4.*pi.*r)).*etha.*B.*I.*L.*sin(x).*cos((2.*pi.*F).*q-B.*r+pi./2+T);
subplot(2,2,1)
plot(x,E)
title('Electric Field')
H=(1./(4.*pi.*r)).*B.*I.*L.*sin(x).*cos((2.*pi.*F).*q-B.*r+pi./2+T);
subplot(2,2,2)
plot(x,H)
title('Magnetic Field')
subplot(2,2,3)
P=sin(x);
polar(x,P)
hold on
p=sin(-x);
polar(x,p)
view(-270,-90)
title('Antenna pattern')
disp('************************** Resistance density(Rr)= ***************************')
Rr=80.*(pi).*(pi).*(L/lambda)^2
disp('************************** Directivity= ****************************************')
D=3/2
%current plot
subplot(2,2,4)
z=-L/2:0.001:L/2;
ii=I.*cos(2.*pi.*F.*z+T);
plot(ii,z)
title('Current distribution')
figure
% 1.- 3-D Mesh: Azimut & Elevation
%----------------------------------
n_tehta = 130; % Samples on Elevation
n_phi = 130; % Samples on Azimut
[tehta,phi]=meshgrid(eps:pi./(n_tehta-1):pi,...
0:2*pi./(n_phi-1):2*pi) ;
radio = sin(tehta);
X=radio.*sin(tehta).*cos(phi);
Y=radio.*sin(tehta).*sin(phi);
Z=radio.*cos(tehta);
surf(X,Y,Z)
camlight right
light
shading interp
colorbar
axis image
rotate3D on
TITLE('3D-Pattern plot')
elseif (L>lambda/50)&(L<=lambda/10)
%SMALL DIPOLE
%CALCULATE-------------------------------------------------------
disp('~~~~~~~~~~~~~~~~~~SMALL DIPOLE~~~~~~~~~~~~~~~~~~~~~~~~~~~~~~')
r=1000*lambda/(2*pi);
x=0:0.0005:pi;
q=0:0.001:2*pi;
E=(1./(8.*pi.*r)).*etha.*B.*I.*L.*sin(x).*cos(((w).*q)-B.*r+pi./2+T);
subplot(2,2,1)
plot(x,E)
title('Electric Field')
H=(1./(8.*pi.*r)).*B.*I.*L.*sin(x).*cos(((w).*q)-B.*r+pi./2+T);
subplot(2,2,2)
plot(x,H)
title('Magnetic Field')
subplot(2,2,3)
P=sin(x);
polar(x,P)
hold on
p=sin(-x);
polar(x,p)
view(-270,-90)
title('Antenna pattern')
disp('************************** Resistance density(Rr)= ***************************')
Rr=20.*(pi).*(pi).*(L/lambda).^2
disp('************************** Directivity= ****************************************')
D=3/2
subplot(2,2,4)
z=0:0.000001:L/2;
ii=I.*cos(2.*pi.*F.*z+T).*(1-(2/L).*z);
plot(ii,z)
hold on
z=-L/2:0.000001:0;
ii=I.*cos(2.*pi.*F.*z+T).*(1+(2/L).*z);
plot(ii,z)
figure
% 1.- 3-D Mesh: Azimut & Elevation
n_tehta = 130; % Samples on Elevation
n_phi = 130; % Samples on Azimut
[tehta,phi]=meshgrid(eps:pi./(n_tehta-1):pi,...
0:2*pi./(n_phi-1):2*pi) ;
radio = sin(tehta);
X=radio.*sin(tehta).*cos(phi);
Y=radio.*sin(tehta).*sin(phi);
Z=radio.*cos(tehta);
surf(X,Y,Z)
camlight right
light
shading interp
colorbar
axis image
rotate3D on
TITLE('3D-Pattern plot')
else
disp('~~~~~~~~~~~~~~~~~~~~~~~~~~~~~~~~~~~~FINITE LENGTH DIPOLE~~~~~~~~~~~~~~~~~~~~~~~~~~~~~~')
r=1000000*lambda/(2*pi);
x=eps:0.001:2*pi;
q=eps:0.001:2*pi;
A=cos(B.*L/2);
p=cos(cos(x).*B.*L/2)-A;
m=p./sin(x);
E=(1./(2.*pi.*r)).*etha.*B.*I.*L.*m.*cos(((w).*q)-B.*r+pi./2+T);
subplot(2,3,1)
plot(x,E)
title('Electric Field')
H=(1./(2.*pi.*r)).*B.*I.*L.*m.*cos(((w).*q)-B.*r+pi./2+T);
subplot(2,3,2)
plot(x,H)
title('Magnetic Field')
subplot(2,3,3)
polar(x,m,'r')
hold on
m=-p./sin(x);
polar(x,m,'r')
view(-270,-90)
title('Antenna pattern')
subplot(2,3,4)
z=0:0.00001:L/2;
ii=I.*cos((w).*z+T).*(sin(B.*(-z+L/2)));
plot(ii,z)
hold on
z=-L/2:0.00001:0;
ii=I.*cos((w).*z+T).*(sin(B.*(z+L/2)));
plot(ii,z)
grid on
title('Current Distribution')
disp('************************** Resistance density(Rr)= ***************************')
rr=(0.5772+log(B*L))-cosint(B*L);
ro=rr+(1/2).*sin(B*L)*(sinint(2*B*L)-2*sinint(B*L));
Q=ro+(1/2).*cos(B*L)*(0.5772+log(B*L/2)+cosint(2*B*L)-2*cosint(B*L));
Rr=(etha/(2*pi)).*Q
subplot(2,3,5)
D=2.*(m.^2)./Q;
polar(x,D,'k')
view(-270,-90)
title('Directivity')
figure
% 1.- 3-D Mesh: Azimut & Elevation
n_tehta = 130; % Samples on Elevation
n_phi = 130; % Samples on Azimut
[tehta,phi]=meshgrid(eps:pi./(n_tehta-1):pi,...
0:2*pi./(n_phi-1):2*pi) ;
Bas = L/lambda; % Half Wave Dipole
Num = cos(pi*Bas*cos(tehta))-cos(pi*Bas);
Den = sin(tehta);
radio = Num./Den;
X=radio.*sin(tehta).*cos(phi);
Y=radio.*sin(tehta).*sin(phi);
Z=radio.*cos(tehta);
surf(X,Y,Z)
camlight right
light
shading interp
colorbar
axis image
rotate3D on
TITLE('3D-Pattern plot')
end
disp(' ')
disp('press any key to go to manipulation of feeder section')
pause
%-------------------manipulation of feeder--------
clc
close all hidden
disp('....................................change posision of feeder...........................')
f=input('Enter Frequency:\n');
disp('------------------------------------------------------------')
lambda=3e8/f
disp('------------------------------------------------------------')
L=input('Enter L(length of dipole:\n');
disp('Please enter any key to continue...')
pause
disp('------------------------------------------------------------')
disp('L/2')
L/2
disp('------------------------------------------------------------')
i=input('current:\n');
b=2*pi/lambda;
n=L/(lambda/2);
if n<=1;
disp('dipole antenna is lambda/2 or smaller ')
disp('---------------------------------------')
h=input('position of feeder,posision must be 0
if (h>L/2)|(h<-L/2)
error('you enter position feeder greater than Length of dipole')
return
end
disp(' ')
disp('Rradiational when change posision feeder=')
Rr_new=Rr./((sin(B.*((L/2)-h))).^2)
Rr_old=Rr
xp=h;
yp=-i:0.00001:-i+(i/100);
plot(yp,xp,'dr')
hold on
x=-L/2:0.01:L/2;
y=i*sin(b*((L/2)-(x+h)));
plot(y,x)
grid on
elseif n==2;
disp('Length dipole antenna is lambda ')
disp('---------------------------------------')
h=input('position of feeder,posision must be 0
if (h>L/2)|(h<-L/2)
error('you enter position feeder greater than Length of dipole')
return
end
disp(' ')
disp('Rradiational when change posision feeder=')
Rr_new=Rr./((sin(B.*((L/2)-h))).^2)
Rr_old=Rr
xp=h;
yp=-i:0.001:-i+(i/100);
plot(yp,xp,'sr')
hold on
grid on
if h==0
x=0:0.01:L/2;
y=i*sin(b*((L/2)-(x+h)));
plot(y,x)
hold on
x=-L/2:0.01:0;
y=i*sin(b*((L/2)+(x+h)));
plot(y,x)
grid on
elseif h>0
x=0:0.01:L/2;
y=i*sin(b*((L/2)-(x+h)));
plot(y,x)
hold on
x=-L/2:0.01:0;
y=i*sin(pi+b*((L/2)+(x+h)));
plot(y,x)
grid on
else
x=-L/2:0.01:0;
y=i*sin(pi+b*((L/2)-(x+h)));
plot(y,x)
hold on
x=0:0.01:L/2;
y=i*sin(b*((L/2)+(x+h)));
plot(y,x)
grid on
end
elseif n==3;
disp('Length dipole antenna is 3*lambda/2 ')
disp('---------------------------------------')
h=input('position of feeder,posision must be 0
if (h>L/2)|(h<-L/2)
error('you enter position feeder greater than Length of dipole')
return
end
disp(' ')
disp('Rradiational when change posision feeder=')
Rr_new=Rr./((sin(B.*((L/2)-h))).^2)
Rr_old=Rr
xp=h;
yp=-i:0.001:-i+(i/100);
plot(yp,xp,'sr')
hold on
x=-L/2:0.01:L/2;
y=i*sin(pi+b*((L/2)-(x+h)));
plot(y,x)
grid on
elseif n==4;
disp('Length dipole antenna is 2*lambda ')
disp('---------------------------------------')
h=input('position of feeder,posision must be 0
if (h>L/2)|(h<-L/2)
error('you enter position feeder greater than Length of dipole')
return
end
disp(' ')
disp('Rradiational when change posision feeder=')
Rr_new=Rr./((sin(B.*((L/2)-h))).^2)
Rr_old=Rr
xp=h;
yp=-i:0.001:-i+0.1;
plot(yp,xp,'sr')
hold on
grid on
if h==0
x=0:0.01:L/2;
y=i*sin(b*((L/2)-(x+h)));
plot(y,x)
hold on
x=-L/2:0.01:0;
y=i*sin(b*((L/2)+(x+h)));
plot(y,x)
grid on
elseif (0 x=0:0.01:lambda/2; y=i*sin(pi+b*((L/2)-(x+h))); plot(y,x) hold on x=lambda/2:0.01:lambda; y=i*sin(pi+b*((L/2)-(x+h))); plot(y,x) x=0:-0.01:-lambda/2; y=i*sin(pi+b*((L/2)-(x+h))); plot(y,x) x=-lambda/2:-0.01:-lambda; y=i*sin(pi+b*((L/2)-(x+h))); plot(y,x) grid on elseif ((lambda/2) x=lambda/2:0.01:lambda; y=i*sin(pi+b*((L/2)-(x+h))); plot(y,x) hold on x=0:0.01:lambda/2; y=i*sin(pi+b*((L/2)-(x+h))); plot(y,x) x=0:-0.01:-lambda/2; y=i*sin(pi+b*((L/2)-(x+h))); plot(y,x) x=-lambda/2:-0.01:-lambda; y=i*sin(pi+b*((L/2)-(x+h))); plot(y,x) grid on elseif ((-lambda/2) x=lambda/2:0.01:lambda; y=i*sin(pi+b*((L/2)+(x+h))); plot(y,x) hold on x=0:0.01:lambda/2; y=i*sin(pi+b*((L/2)+(x+h))); plot(y,x) x=0:-0.01:-lambda/2; y=i*sin(pi+b*((L/2)+(x+h))); plot(y,x) x=-lambda/2:-0.01:-lambda; y=i*sin(pi+b*((L/2)+(x+h))); plot(y,x) grid on else ((-lambda/2)>h)&(h>(-lambda)); x=lambda/2:0.01:lambda; y=i*sin(pi+b*((L/2)+(x+h))); plot(y,x) hold on x=0:0.01:lambda/2; y=i*sin(pi+b*((L/2)+(x+h))); plot(y,x) x=0:-0.01:-lambda/2; y=i*sin(pi+b*((L/2)+(x+h))); plot(y,x) x=-lambda/2:-0.01:-lambda; y=i*sin(pi+b*((L/2)+(x+h))); plot(y,x) grid on end else disp('Length dipole antenna is greater than 2*lambda and undefined ') disp('--------------------Exit----------------------') end [1]梁荣江. 基于Matlab分析矩量法在线天线中的应用[J]. 西安邮电学院学报, 2009. ❤️部分理论引用网络文献,若有侵权联系博主删除 ❤️ 关注我领取海量matlab电子书和数学建模资料⛄ 运行结果
⛄ 参考文献
⛄ 完整代码

