RNA 19. SCI 文章中无监督聚类法 (ConsensusClusterPlus)
点击关注,桓峰基因
桓峰基因
生物信息分析,SCI文章撰写及生物信息基础知识学习:R语言学习,perl基础编程,linux系统命令,Python遇见更好的你
83篇原创内容
公众号
基于RNA数据做临床预测时,我们往往并不知道该对样本怎么分类,那么就需要对肿瘤样本进行分类或者说分型,此时我们可以选择无监督机器学习的方法,在这里我想介绍一个非常好用的工具,很多文章都有利用该方法进行分型的,效果极好!
前 言
一致性聚类是一种为确定数据集中可能的聚类的数量和成员提供定量证据的方法,例如作为微阵列基因表达。这种方法在癌症基因组学中得到了广泛应用,在那里发现了新的疾病分子亚类。一致性聚类方法包括从一组项目中进行次抽样,例如微阵列,并确定特定簇计数(k)的簇。然后,对共识值,两个项目占在同一子样本中发生的次数中有相同的聚类,计算并存储在每个k的对称一致矩阵中。
摘要
无监督类发现在癌症研究中是一种非常有用的技术,其中共享生物学特征的内在群体可能存在,但未知。共识聚类(CC)方法为估计数据集中无监督类的数量提供了定量和可视化的稳定性证据。ConsensusClusterPlus在R中实现了CC方法,并通过新的功能和可视化(包括项目跟踪、项目共识和集群共识图)对其进行了扩展。这些新特性为用户提供了详细的信息,支持在无监督类发现中做出更具体的决策。
实例解析
ConsensusClusterPlus是我见过比较简单的包了,基本上只有一步就可以对基因进行聚类。对于这类算法我们比较头疼的是K值的确定,可以使用一些其他算法辅助K值的确定。
1. 软件安装
安装使用BiocManager来安装即可,如下:
if (!requireNamespace("ConsensusClusterPlus", quietly = TRUE)) {
    BiocManager::install("ConsensusClusterPlus")
}

library(ConsensusClusterPlus)
2. 数据读取
DEG = read.table("DEG-resdata.xls", sep = "\t", check.names = F, header = T)
table(DEG$sig)
##
## Down   Up
## 1296 2832
group <- read.table("DEG-group.xls", sep = "\t", check.names = F, header = T)
table(group$Group)
##
##  NT  TP
##  41 478
exp <- DEG[, 8:ncol(DEG)]
exp[1:3, 1:3]
##   TCGA-3L-AA1B-01A-11R-A37K-07 TCGA-4N-A93T-01A-11R-A37K-07
## 1                           20                           15
## 2                          175                          108
## 3                           49                           13
##   TCGA-4T-AA8H-01A-11R-A41B-07
## 1                           49
## 2                           59
## 3                            6
dim(exp)
## [1] 4128  519
rownames(exp) = DEG[, 1]
TP <- group[group$Group %in% "TP", ]$Sample
TumorMat <- exp[, TP]
TumorMat[1:3, 1:3]
##                 TCGA-D5-6530-01A-11R-1723-07 TCGA-G4-6320-01A-11R-1723-07
## ENSG00000142959                           33                          122
## ENSG00000163815                           39                           59
## ENSG00000107611                           19                           10
##                 TCGA-AD-6888-01A-11R-1928-07
## ENSG00000142959                           42
## ENSG00000163815                           13
## ENSG00000107611                            6
dim(TumorMat)
## [1] 4128  478
3. 实操
实操之前我们先了解一些参数的设置,如下:pItem (item resampling, proportion of items to sample) : 80% pFeature (gene resampling, proportion of features to sample) : 80% maxK (a maximum evalulated k, maximum cluster number to evaluate) : 6 reps (resamplings, number of subsamples) : 50 clusterAlg (agglomerative heirarchical clustering algorithm) : ‘hc’ (hclust) distance : ‘pearson’ (1 - Pearson correlation)
运行如下:
library(ConsensusClusterPlus)
title = tempdir()
results <- ConsensusClusterPlus(as.matrix(TumorMat), maxK = 6, reps = 50, pItem = 0.8,
    pFeature = 0.8, clusterAlg = "hc", distance = "pearson", title = title, plot = "png")
之后进行提取基因集等后续操作,ConsensusClusterPlus的输出是一个列表,其中列表对应于来自KTH集群的结果,例如,results[[2]]是结果k=2。consensusMatrix输出一致矩阵,如下:
# 输出K=3时的一致性矩阵
consensusTree <- results[[3]][["consensusTree"]]
consensusTree
##
## Call:
## hclust(d = as.dist(1 - fm), method = finalLinkage)
##
## Cluster method   : average
## Number of objects: 478
# hclust选项
consensusMatrix <- results[[3]][["consensusMatrix"]]
consensusMatrix[1:5, 1:5]
##      [,1] [,2] [,3] [,4] [,5]
## [1,]    1    1    1    1    1
## [2,]    1    1    1    1    1
## [3,]    1    1    1    1    1
## [4,]    1    1    1    1    1
## [5,]    1    1    1    1    1
# 样本分类
consensusClass <- results[[3]][["consensusClass"]]
4. 结果展示
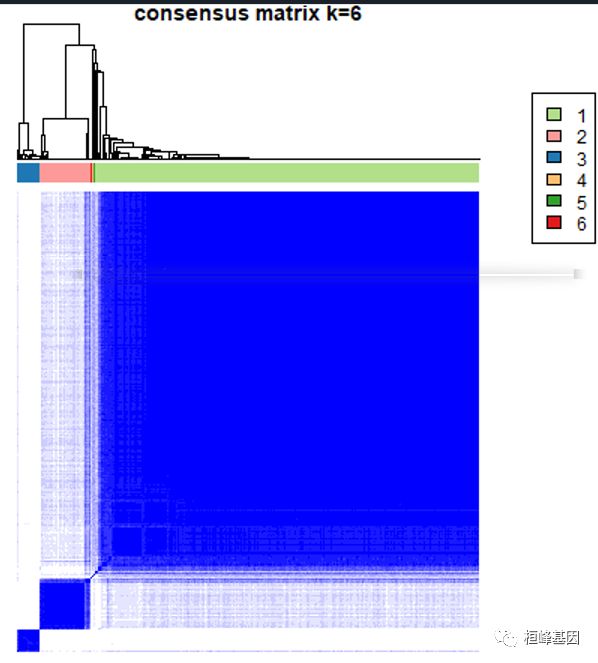
1. 一致性矩阵
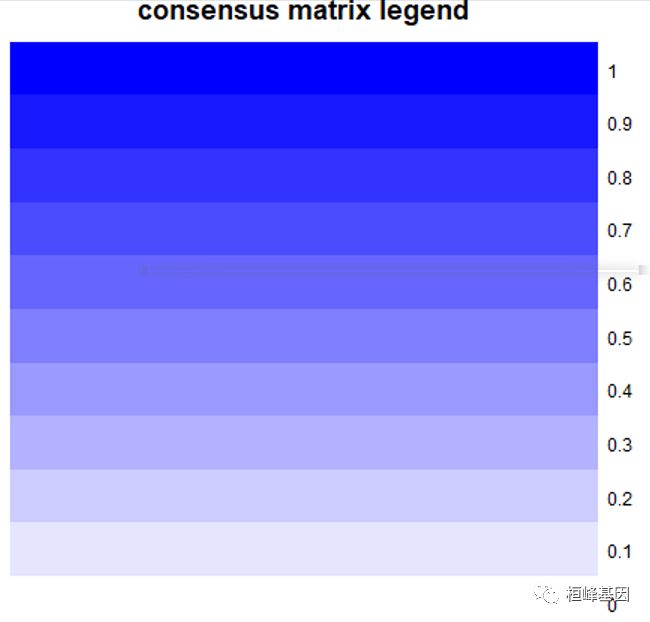
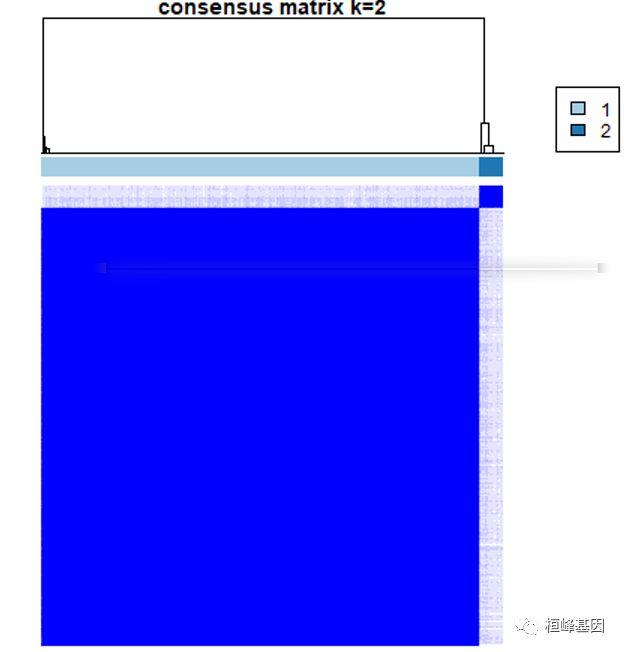
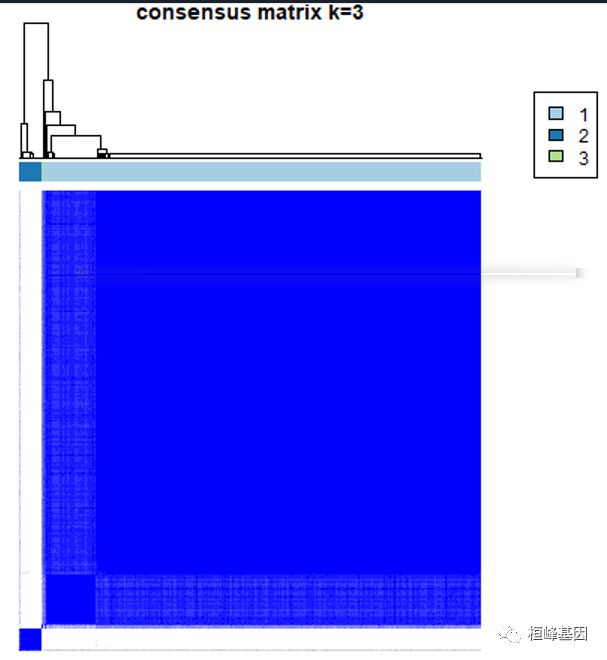
For each k, CM plots depict consensus values on a white to blue colour scale, are ordered by the consensus clustering which is shown as a dendrogram, and have items’ consensus clusters marked by coloured rectangles between the dendrogram and consensus values
2. 一致性累积分布函数图
Empirical cumulative distribution function (CDF) plots display consensus distributions for each k.
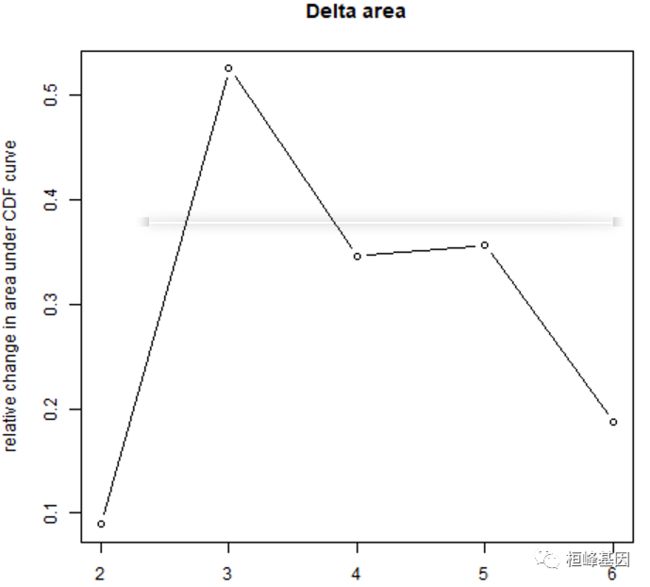
3. 碎石图
这个之前我们有讲过,机器学习里面又提过 MachineLearning 3. 聚类分析(Cluster Analysis)。
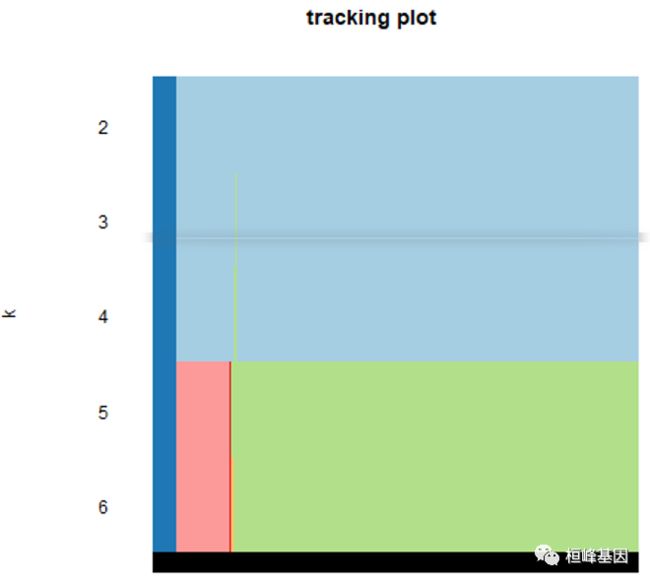
4. 跟踪图
The item tracking plot shows the consensus cluster of items (in columns) at each k (in rows). This allows a user to track an item’s cluster assignments across different k, to identify promiscuous items that are suggestive of weak class membership, and to visualize the distribution of cluster sizes across k.
5. 聚类一致性(cluster-consensus)和样品一致性(item-consensus)
#计算聚类一致性 (cluster-consensus) 和样品一致性 (item-consensus)
icl <- calcICL(results,
               #title = title,
               plot = "png")
## 返回了具有两个元素的list,然后分别查看一下
dim(icl[["clusterConsensus"]])
## [1] 20  3

icl[["clusterConsensus"]]
##       k cluster clusterConsensus
##  [1,] 2       1        0.9979464
##  [2,] 2       2        0.9530334
##  [3,] 3       1        0.9701812
##  [4,] 3       2        0.9425426
##  [5,] 3       3        0.8425318
##  [6,] 4       1        0.9174626
##  [7,] 4       2        0.9312305
##  [8,] 4       3        0.7829472
##  [9,] 4       4              NaN
## [10,] 5       1        0.9724148
## [11,] 5       2        0.9584888
## [12,] 5       3        0.9302702
## [13,] 5       4        0.7829472
## [14,] 5       5              NaN
## [15,] 6       1        0.9450896
## [16,] 6       2        0.9548545
## [17,] 6       3        0.9244208
## [18,] 6       4        0.9655172
## [19,] 6       5        0.7829472
## [20,] 6       6        1.0000000

dim(icl[["itemConsensus"]])
## [1] 9560    4

icl[["itemConsensus"]][1:5,]
##   k cluster                         item itemConsensus
## 1 2       1 TCGA-AA-A00O-01A-02R-A089-07     0.3334626
## 2 2       1 TCGA-AA-3664-01A-01R-0905-07     0.2818590
## 3 2       1 TCGA-A6-3810-01A-01R-A278-07     0.1793995
## 4 2       1 TCGA-A6-2677-01B-02R-A277-07     0.1349282
## 5 2       1 TCGA-A6-2674-01A-02R-A278-07     0.1842922
聚类一致性(cluster-consensus)
This plot is similar to colour maps (Hoffmann et al., 2007). Item-consensus (IC) is the average consensus value between an item and members of a consensus cluster, so that there are multiple IC values for an item at a k corresponding to the k clusters. IC plots display items as vertical bars of coloured rectangles whose height corresponds to IC values.
样品一致性(item-consensus)
Cluster-consensus (CLC) is the average pairwise IC of items in a consensus cluster. The CLC plot displays these values as a bar plot that are grouped at each k
桓峰基因公众号,可以做RNA系列分析,都是SCI级别分析方法,今天刚好整理了一下:
RNA 1. 基因表达那些事–基于 GEO
RNA 2. SCI文章中基于GEO的差异表达基因之 limma
RNA 3. SCI 文章中基于T CGA 差异表达基因之 DESeq
RNA 4. SCI 文章中基于TCGA 差异表达之 edgeR
RNA 5. SCI 文章中差异基因表达之 MA 图
RNA 6. 差异基因表达之-- 火山图 (volcano)
RNA 7. SCI 文章中的基因表达——主成分分析 (PCA)
RNA 8. SCI文章中差异基因表达–热图 (heatmap)
RNA 9. SCI 文章中基因表达之 GO 注
RNA 10. SCI 文章中基因表达富集之–KEGG
RNA 11. SCI 文章中基因表达富集之 GSE
RNA 12. SCI 文章中肿瘤免疫浸润计算方法之 CIBERSORT
RNA 13. SCI 文章中差异表达基因之 WGCNA
RNA 14. SCI 文章中差异表达基因之 蛋白互作网络 (PPI)
RNA 15. SCI 文章中的融合基因之 FusionGDB2
RNA 16. SCI 文章中的融合基因之可视化
RNA 17. SCI 文章中的筛选 Hub 基因 (Hub genes)
RNA 18. SCI 文章中基因集变异分析 GSVA
RNA 19. SCI 文章中无监督聚类法 (ConsensusClusterPlus)
我们每周都会推出1-2篇可以直接使用公众号生信分析方法进行文章的复现,关注桓峰基因,科研路上不迷路,想做科研没思路,加我微信获得最快的资讯!
References:
-
Wilkerson MD, Hayes DN. ConsensusClusterPlus: a class discovery tool with confidence assessments and item tracking. Bioinformatics. 2010;26(12):1572-1573.
-
Monti, S., Tamayo, P., Mesirov, J., Golub, T. (2003) Consensus Clustering: A Resampling-Based Method for Class Discovery and Visualization of Gene Expression Microarray Data. Machine Learning, 52, 91-118.
