因果推断5--DML(个人笔记)
目录
1论文介绍
1.1论文
1.2摘要
1.3DML思路
2价格需求曲线
2.1价格需求弹性
2.2价格需求弹性计算DML代码
2.3价格需求弹性例子--数据集
2.4建模过程
2.5回归结果
1论文介绍
1.1论文
V. Chernozhukov, D. Chetverikov, M. Demirer, E. Duflo, C. Hansen, and a. W. Newey. Double Machine Learning for Treatment and Causal Parameters. ArXiv e-prints 文章链接
1.2摘要
我们重新讨论在高维有害参数η0存在的情况下对低维参数θ0的推理的经典半参数问题。我们通过允许η0的高维值来脱离经典设置,从而打破了限制该对象参数空间复杂性的传统假设,如Donsker性质。为了估计η0,我们考虑使用统计或机器学习(ML)方法,这些方法特别适合于现代高维情况下的估计。在实践中,ML方法通过使用正则化来减少方差,并通过过拟合来抵消正则化偏差,从而取得了较好的效果。然而,在估计η0时的正则化偏倚和过拟合导致θ0的估计量有很大的偏倚,这些估计量是通过天真地将η0的ML估计量代入θ0的估计方程而得到的。这种偏差导致朴素估计量不符合N−1/2,其中N是样本容量。我们表明,正则化偏差和过拟合对感兴趣的参数θ0的估计的影响可以通过使用两个简单但关键的成分来消除:(1)使用内曼正交矩/分数,它降低了对有害参数的敏感性来估计θ0,以及(2)使用交叉拟合,它提供了一种有效的数据分割形式。我们将得到的方法集称为双偏ML或去偏ML (DML)。我们验证了DML提供的点估计集中在真参数值的N−1/2-邻域内,并且近似无偏且正态分布,这允许构建有效的置信度语句。DML的一般统计理论是初级的,同时依赖于薄弱的理论要求,这将允许使用广泛的现代ML方法来估计有害参数,如随机森林、lasso、岭回归、深度神经网络、增强树以及这些方法的各种混合和集成。我们通过应用DML学习部分线性回归模型中的主回归参数,DML学习部分线性工具变量模型中内生变量上的系数,DML学习无混淆情况下平均处理效果和被治疗者的平均处理效果来说明一般理论,应用DML在工具变量设置下学习局部平均处理效果。除了这些理论应用,我们还通过三个经验示例说明了DML的使用。
1.3DML思路
Hetergeneous Treatment Effect旨在量化实验对不同人群的差异影响,进而通过人群定向/数值策略的方式进行差异化实验,或者对实验进行调整。Double Machine Learning把Treatment作为特征,通过估计特征对目标的影响来计算实验的差异效果。
Machine Learning擅长给出精准的预测,而经济学更注重特征对目标影响的无偏估计。DML把经济学的方法和机器学习相结合,在经济学框架下用任意的ML模型给出特征对目标影响的无偏估计
HTE其他方法流派详见 因果推理的春天-实用HTE论文GitHub收藏
2价格需求曲线
2.1价格需求弹性
经济学课程里谈到价格需求弹性,描述需求数量随商品价格的变动而变化的弹性。价格一般不直接影响需求,而是被用户决策相关的中间变量所中介作用。假设 Q 为某个商品的需求的数量,P 为该商品的价格,则计算需求的价格弹性为,
假设线性:
y = a*x +b,弹性是线性。![]()
通过上式可以简单知道,价格改变 1 元比价格改变 100 元,会导致更大的需求改变。比如以 5 元的价格每日可以卖 100 单位产品,如果价格需求弹性为 -3 ,那供应商将价格提升 5%(dp /P,从 5 元-> 5.25 元),需求将下降 15%(dQ/Q ,从 100->85)。那么收入将减少 1005-5.2585=53.75。如果单价降低 5%,那么收入同理将提升 46.25。如果供应商知道了产品的价格弹性,那无须反复测试,即可清楚为提升收入到底应该是提价还是降价。
2.2价格需求弹性计算DML代码
36-methods-for-data-analysis/DML.ipynb at main · Serena-TT/36-methods-for-data-analysis · GitHub
2.3价格需求弹性例子--数据集
原数据是购物篮分析数据,这个数据集包含了一家英国在线零售公司在8个月期间的所有购买行为。![]()
同时对P / Q进行对数化处理:
# 将单价和数量取log
df_mdl = df_mdl.assign(
    LnP = np.log(df_mdl['UnitPrice']),
    LnQ = np.log(df_mdl['Quantity']),
)
理解:P是treatment,Q是Outcome
![]()
2.4建模过程
# 混杂因子针对Q \ P 分别建模
model_y = Pipeline([
    ('feat_proc', feature_generator_full),
    ('model_y', RandomForestRegressor(n_estimators=50, min_samples_leaf=3, n_jobs=-1, verbose=0))
    # n_samples_leaf/n_estimators is set to reduce model (file) size and runtime
    # larger models yield prettier plots.
])
model_t = Pipeline([
    ('feat_proc', feature_generator_full),
    ('model_t', RandomForestRegressor(n_estimators=50, min_samples_leaf=3, n_jobs=-1, verbose=0))
])

# 上述模型得到预估值
# Get first-step, predictions to residualize ("orthogonalize") with (in-sample for now)
q_hat = model_y.predict(df_mdl)
p_hat = model_t.predict(df_mdl)

# 用观测值减去预测得到的值求解残差
df_mdl = df_mdl.assign(
    dLnP_res = df_mdl['dLnP'] - p_hat,
    dLnQ_res = df_mdl['dLnQ'] - q_hat,
)
# 模型训练
import joblib

try: # load existing models, if possible
    model_y = joblib.load('models/step1_model_y.joblib')
    model_t = joblib.load('models/step1_model_t.joblib')
except:
    print('No pre-existing models found, fitting aux models for y and t')
    model_y.fit(df_mdl, df_mdl.dLnQ)
    model_t.fit(df_mdl, df_mdl.dLnP)

    joblib.dump(model_y, 'models/step1_model_y.joblib', compress=True)
    joblib.dump(model_t, 'models/step1_model_t.joblib', compress=True)
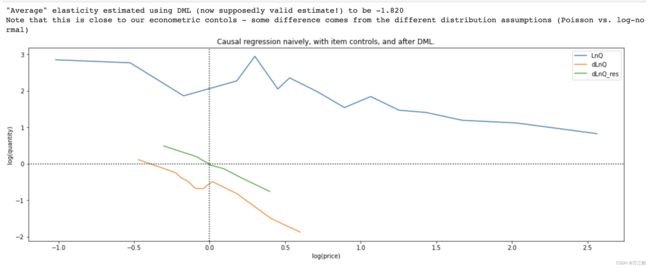
模型残差回归
# 初始ols模型
old_fit = binned_ols(
    df_mdl,
    x='LnP',
    y='LnQ',
    n_bins=15,
)
# 初始去均值化后的ols模型
old_fit = binned_ols(
    df_mdl,
    x='dLnP',
    y='dLnQ',
    n_bins=15,
    plot_ax=plt.gca(),
)
# 残差拟合的ols模型
old_fit = binned_ols(
    df_mdl,
    x='dLnP_res',
    y='dLnQ_res',
    n_bins=15,
    plot_title='Causal regression naively, with item controls, and after DML.',
    plot_ax=plt.gca()
)
plt.gca().set(
    xlabel='log(price)',
    ylabel='log(quantity)',
)

plt.gca().axvline(0, color='k', linestyle=':')
plt.gca().axhline(0, color='k', linestyle=':')


print(
    f'"Average" elasticity estimated using DML (now supposedly valid estimate!) to be {old_fit.params["dLnP_res"]:.3f}\n'
    'Note that this is close to our econometric contols - some difference comes from the different distribution '
    'assumptions (Poisson vs. log-normal)'
)
"Average" elasticity estimated using DML (now supposedly valid estimate!) to be -1.8
回归模型
import statsmodels.api as sm # get full stats on regressions

def binned_ols(df, x, y, n_bins, plot=True, plot_title='', plot_ax=None, **plt_kwargs):
    # A visual form of de-noising: bin explanatory variable first,
    # then take means-per-bin of variable to be explaioned, then regress/plot
    x_bin = x + '_bin'
    df[x_bin] = pd.qcut(df[x], n_bins)

    tmp = df.groupby(x_bin).agg({
        x: 'mean',
        y: 'mean'
    })

    if plot:
        tmp.plot(
            x=x,
            y=y,
            figsize=(18, 6),
            title=plot_title,
            ax=plot_ax,
            **plt_kwargs
        )

    del df[x_bin]
    mdl = sm.OLS(tmp[y], sm.add_constant(tmp[x]))
    res = mdl.fit()
    return res
2.5回归结果
参考
- DML-因果推断 - 知乎
- 因果推断与反事实预测——利用DML进行价格弹性计算(二十四)_悟乙己的博客-CSDN博客_dml算法
- 因果推断-DML - 哔哩哔哩
- 【因果推断/uplift建模】Double Machine Learning(DML) - 知乎
- https://zhuanlan.zhihu.com/p/382218715
- AB实验的高端玩法系列1 - AB实验人群定向/个体效果差异/HTE/Uplift Model 论文github收藏 - 风雨中的小七 - 博客园
- CausalInference - 标签 - 风雨中的小七 - 博客园
- 数据分析三十六计
- GitHub - Serena-TT/36-methods-for-data-analysis
- 如何用Python建立OLS线性回归模型?(stack,sm.OLS) - 知乎
- 机器学习之线性回归——OLS,岭回归,Lasso回归_cpLoners的博客-CSDN博客_lasso与ols


