MATLAB text legend title 输入减号 minus 符号的做法
MATLAB 绘图时 需要用 text legend title 等命令 写上文字,然而,一些常见用法达不到指定的效果(特别是MATLAB的Minus负号(减号)、Hyphen连字符、Dash破折号容易弄混 达不到指定的效果):
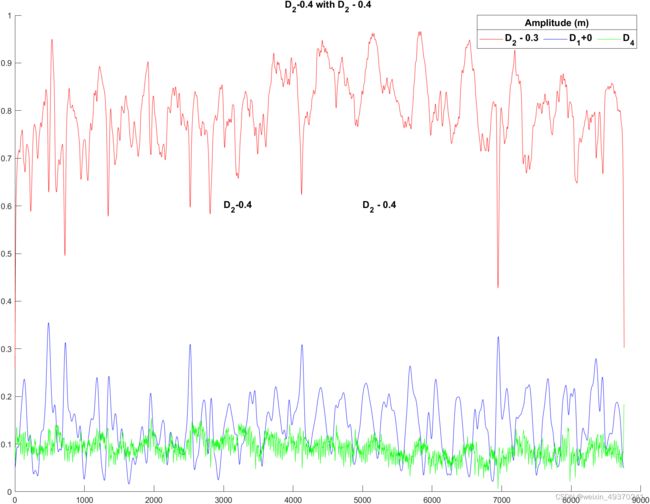
对于legend而言,需指定interpreter这一选项解决这一问题:
% 用法1      'interpreter','tex'

figure()
hold on
plot(tt,Y.D2i-0.3,'r-','linewidth',.5)  % mean(Y.D2i)  1.0969
plot(tt,Y.D1i,'b-','linewidth',.5)  % mean(Y.D1i)  0.1406
plot(tt,Y.D4i,'g-','linewidth',.5)  % mean(Y.D4i)  0.0914
lgd = legend({'D_2 - 0.3','D_1+0','D_4'},'FontSize',12,'Fontweight','bold','Orientation','horizontal',...
             'interpreter','tex')
text(5000,0.6,'D_2 - 0.4','interpreter','tex','fontweight','bold','fontsize',12)   % 注意字符串之间的空格
text(3000,0.6,'D_2-0.4','interpreter','tex','fontweight','bold','fontsize',12)     % 注意字符串之间的空格
title('D_2-0.4 with D_2 - 0.4','fontweight','bold','fontsize',12)                      % 注意字符串之间的空格


legend('boxon');
title(lgd,'Amplitude (m)')
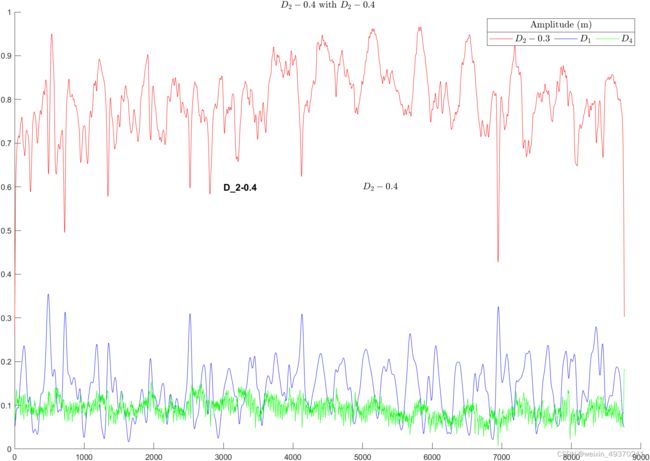
用法2 将interpreter 指定为LaTeX:注意下图的减号 以及字符串之间的空格
figure()
hold on
plot(tt,Y.D2i-0.3,'r-','linewidth',.5)  % mean(Y.D2i)  1.0969
plot(tt,Y.D1i,'b-','linewidth',.5)  % mean(Y.D1i)  0.1406
plot(tt,Y.D4i,'g-','linewidth',.5)  % mean(Y.D4i)  0.0914
lgd = legend({'$D_{2} - 0.3$','$D_{1}$','$D_{4}$'},'FontSize',12,'Fontweight','bold','Orientation','horizontal',...
       'interpreter','latex')
text(5000,0.6,'$D_{2} - 0.4$','interpreter','latex','fontweight','bold','fontsize',12)
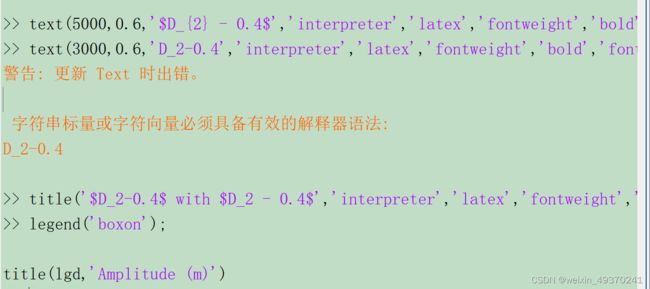
text(3000,0.6,'D_2-0.4','interpreter','latex','fontweight','bold','fontsize',12)                   % 注意MATLAB命令行的警告
title('$D_2-0.4$ with $D_2 - 0.4$','interpreter','latex','fontweight','bold','fontsize',12)  % 第一个字符串之间没有空格

legend('boxon');
title(lgd,'Amplitude (m)')
总结: 如果使用 interpreter 指定为LaTeX,能够很好的展示数学中的减号,并且字符串之间的空格只要识别为数学公式,则自动增加空格(如第二例子title的字符串【 D 2 − 0.4 D_2-0.4 D2−0.4】之间没有空格)
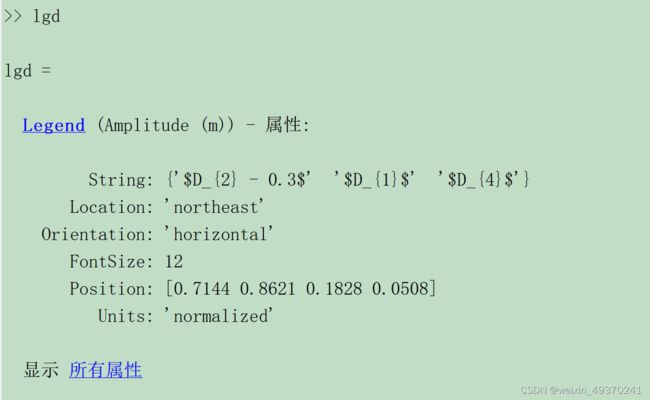
在MATLAB命令行输入 lgd 可以查看所有属性,


可以修改这些属性: lgd.FontName = ‘times new roman’
关于 LaTeX的数学公式,可仿照 下面的示例
https://www.jianshu.com/p/8d9c851ae3bd/


