按照《生信技能树30道练习题带你玩转统计学的R语言版》其中的代码进行-探索
data(iris)
Q1: 载入R中自带的数据集 iris,指出其每列是定性还是定量数据
str(iris)
    'data.frame':	150 obs. of  5 variables:
 $ Sepal.Length: num  5.1 4.9 4.7 4.6 5 5.4 4.6 5 4.4 4.9 ...
 $ Sepal.Width : num  3.5 3 3.2 3.1 3.6 3.9 3.4 3.4 2.9 3.1 ...
 $ Petal.Length: num  1.4 1.4 1.3 1.5 1.4 1.7 1.4 1.5 1.4 1.5 ...
 $ Petal.Width : num  0.2 0.2 0.2 0.2 0.2 0.4 0.3 0.2 0.2 0.1 ...
 $ Species     : Factor w/ 3 levels "setosa","versicolor",..: 1 1 1 1 1 1 1 1 1 1 ...
Q2: 对数据集 iris的所有定量数据列计算集中趋势指标:`众数、分位数和平均数
{
  data=iris[,1:4]
  #众数
  myfun=function(x){
    tmp=table(x)
    index=which.max(tmp)
    a=tmp[index]
    return(c(tmp,a))
  }
  #分位数
  #平均数
  apply(data,2,summary)

}
结果如下
    apply(data,2,summary)
        Sepal.Length Sepal.Width Petal.Length Petal.Width
Min.        4.300000    2.000000        1.000    0.100000
1st Qu.     5.100000    2.800000        1.600    0.300000
Median      5.800000    3.000000        4.350    1.300000
Mean        5.843333    3.057333        3.758    1.199333
3rd Qu.     6.400000    3.300000        5.100    1.800000
Max.        7.900000    4.400000        6.900    2.500000
Q3:对数据集 iris的所有定性数据列计算水平及频次
    if(F){
  data2=iris[,5]
  head(data2)
  levels(data2)
  summary(data2)
}
结果如下:
summary(data2)
setosa versicolor virginica
50 50 50
Q4:对数据集 iris的所有定量数据列计算离散趋势指标:方差和标准差等
#q4 var sd
  if(F){
      apply(data, 2, var)
      apply(data, 2, sd)
    }

> apply(data, 2, var)
Sepal.Length  Sepal.Width Petal.Length  Petal.Width
   0.6856935    0.1899794    3.1162779    0.5810063
> apply(data, 2, sd)
Sepal.Length  Sepal.Width Petal.Length  Petal.Width
   0.8280661    0.4358663    1.7652982    0.7622377
Q5:计算数据集 iris的前两列变量的相关性,提示cor函数可以选择3种methods
cor(iris[,1:2],method ="pearson" )
cor(iris[,1:2],method ="kendall" )
cor(iris[,1:2],method ="spearman" )
结果如下:
> cor(iris[,1:2],method ="pearson" )
             Sepal.Length Sepal.Width
Sepal.Length    1.0000000  -0.1175698
Sepal.Width    -0.1175698   1.0000000
> cor(iris[,1:2],method ="kendall" )
             Sepal.Length Sepal.Width
Sepal.Length   1.00000000 -0.07699679
Sepal.Width   -0.07699679  1.00000000
> cor(iris[,1:2],method ="spearman" )
             Sepal.Length Sepal.Width
Sepal.Length    1.0000000  -0.1667777
Sepal.Width    -0.1667777   1.0000000
Q6对数据集 iris的所有定量数据列内部zcore标准化,并计算标准化后每列的平均值和标准差
datanor=data[,1:2]
datanor=scale(datanor, center=T,scale=T)
apply(datanor,2,mean)
apply(datanor,2,sd)
> apply(datanor,2,mean)
 Sepal.Length   Sepal.Width
-4.484318e-16  2.034094e-16
> apply(datanor,2,sd)
Sepal.Length  Sepal.Width
           1            1
结果可以看到标准化(z-score)后的数据变成了均值为零,标准差为1的数据分布。
Q7:计算列内部zcore标准化后 iris的前两列变量的相关性
 cor(datanor)
  > cor(datanor)
             Sepal.Length Sepal.Width
Sepal.Length    1.0000000  -0.1175698
Sepal.Width    -0.1175698   1.0000000
Q8: 根据数据集 iris的第五列拆分数据集后重复上面的Q2到Q7问题
首先按照第五列数据(setosa versicolor virginica)按照挑出来,下面以virginica为例:(所有2-7操作如上,不知道有没有简单的方法,网上搜的到用Grep)
data3=iris[grep(pattern ="virginica",data3[,5]),]
data3=data3[,1:4]
size=72
Q9Q10


 data(mtcars)
a=mtcars
head(a)
dim(mtcars)
str(mtcars)
apply(mtcars,2,myfun)
apply(mtcars,2,summary)
apply(mtcars,2,var)
apply(mtcars,2,sd)
cor(mtcars[,1:2])
mtcarsnor=scale(mtcars,scale=TRUE,center=TRUE)
head(mtcarsnor)
apply(mtcarsnor,2,sd)
apply(mtcarsnor,2,mean)
cor(mtcarsnor[,1:2])
library(airway)
data(airway)
expr=assay(airway)
head(expr)
cor(expr[,1:8])
以下均按照jimmy大神的代码:仅仅列出部分
 pos=which.max(rowSums(expr))
> t.test(expr[pos,]~RNAseq_gl)

	Welch Two Sample t-test

data:  expr[pos, ] by RNAseq_gl
t = -0.38395, df = 5.4052, p-value = 0.7157
alternative hypothesis: true difference in means is not equal to 0
95 percent confidence interval:
 -215448.0  158352.5
sample estimates:
  mean in group trt mean in group untrt
           314538.8            343086.5

> pos
ENSG00000115414
           4464
> pos=which.max(apply(expr,1,mad))
> t.test(expr[pos,]~RNAseq_gl)

	Welch Two Sample t-test

data:  expr[pos, ] by RNAseq_gl
t = -0.89974, df = 5.9757, p-value = 0.4031
alternative hypothesis: true difference in means is not equal to 0
95 percent confidence interval:
 -207570.91   96040.91
sample estimates:
  mean in group trt mean in group untrt
           272857.5            328622.5

> pos
ENSG00000011465
            305
> expr1=log2(expr+1)
> pos=which.max(rowSums(expr1))
> pos
ENSG00000115414
           4464
> t.test(expr1[pos,]~RNAseq_gl)

	Welch Two Sample t-test

data:  expr1[pos, ] by RNAseq_gl
t = -0.33902, df = 5.8928, p-value = 0.7464
alternative hypothesis: true difference in means is not equal to 0
95 percent confidence interval:
 -0.8824523  0.6685158
sample estimates:
  mean in group trt mean in group untrt
           18.21958            18.32655

> pos=which.max(apply(expr1,1,mad))
> pos
ENSG00000109906
           3751
> t.test(expr[pos,]~RNAseq_gl)

	Welch Two Sample t-test

data:  expr[pos, ] by RNAseq_gl
t = 4.8347, df = 3.0015, p-value = 0.01685
alternative hypothesis: true difference in means is not equal to 0
95 percent confidence interval:
  242.7752 1177.2248
sample estimates:
  mean in group trt mean in group untrt
              715.5                 5.5
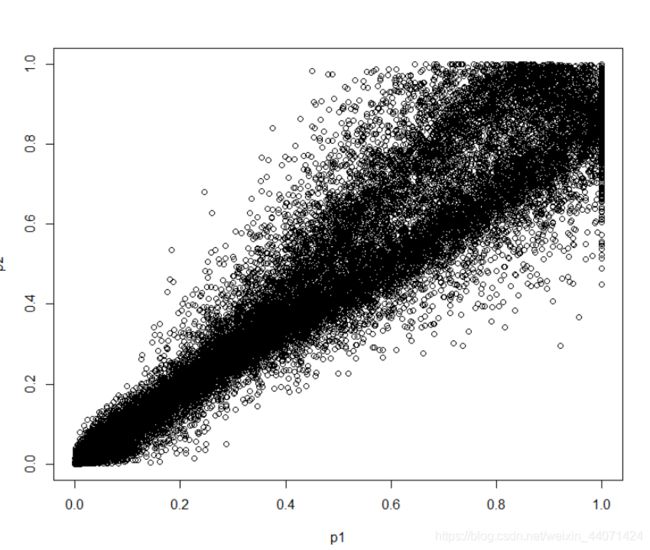
最后的一个相关性图


