pandas:世界各国GDP数据集数据清洗案例
数据集:世界各国1960年至2020年国内生产总值
数据格式:CSV
数据来源:World Bank
实验环境:Jupyter Notebook
网盘链接: 百度网盘-GDP数据集
文章目录
-
-
-
-
- 1.1 依赖准备
- 1.2 数据准备
- 1.3 数据观察
-
- (1) 观察数据形状
- (2) 观察数据前五行
- (3) 观察数据列名称列表
- (4) 观察各列数据类型
- (5) 观察结果
- 1.4 数据清洗
-
- (1) 去除无用字段
- (2) 确定缺失值
- (3) 去除过多缺失的行列
- (4) 填充缺失值
- (5) 检验异常值
- (6) 其余步骤
-
-
-
1.1 依赖准备
import numpy as np
import pandas as pd
import matplotlib.pyplot as plt
首先导入相关依赖,pandas/numpy用于数据处理 ,matplotlib.pyplot 用于数据可视化
1.2 数据准备
读入数据 此行代码需要将CSV文件与ipynb文件放置在同一目录下
df = pd.read_csv('GDP.csv',encoding = 'utf-8')
完成数据读取后,数据就以DataFrame类型存储在环境中
1.3 数据观察
(1) 观察数据形状
df.shape
(266, 65)
(2) 观察数据前五行
df.head()
| Country Name | Country Code | Indicator Name | Indicator Code | 1960 | 1961 | 1962 | 1963 |
|---|---|---|---|---|---|---|---|
| 阿鲁巴 | ABW | GDP(现价美元) | NY.GDP.MKTP.CD | NA | NA | NA | NA |
| NA | AFE | GDP(现价美元) | NY.GDP.MKTP.CD | 1.93E+10 | 1.97E+10 | 2.15E+10 | 2.57E+10 |
| 阿富汗 | AFG | GDP(现价美元) | NY.GDP.MKTP.CD | 5.38E+08 | 5.49E+08 | 5.47E+08 | 7.51E+08 |
| NA | AFW | GDP(现价美元) | NY.GDP.MKTP.CD | 1.04E+10 | 1.11E+10 | 1.19E+10 | 1.27E+10 |
| 安哥拉 | AGO | GDP(现价美元) | NY.GDP.MKTP.CD | NA | NA | NA | NA |
(3) 观察数据列名称列表
df.columns
Index(['Country Name', 'Country Code', 'Indicator Name', 'Indicator Code',
       '1960', '1961', '1962', '1963', '1964', '1965', '1966', '1967', '1968',
       '1969', '1970', '1971', '1972', '1973', '1974', '1975', '1976', '1977',
       '1978', '1979', '1980', '1981', '1982', '1983', '1984', '1985', '1986',
       '1987', '1988', '1989', '1990', '1991', '1992', '1993', '1994', '1995',
       '1996', '1997', '1998', '1999', '2000', '2001', '2002', '2003', '2004',
       '2005', '2006', '2007', '2008', '2009', '2010', '2011', '2012', '2013',
       '2014', '2015', '2016', '2017', '2018', '2019', '2020'],
      dtype='object')
(4) 观察各列数据类型
df.dtypes
Country Name       object
Country Code       object
Indicator Name     object
Indicator Code     object
1960              float64
                   ...
2016              float64
2017              float64
2018              float64
2019              float64
2020              float64
(5) 观察结果
结合上述代码及运行结果,我们观察到
- 二维数据 共计266行65列
- 数据前四列解释了国家与指标
- 后续列均为年份 数据类型为浮点数(float64)
- 每行均为一个国家实体
1.4 数据清洗
完成数据观察后,我们对该数据集有了一个整体的印象,之后进行数据清洗。
(1) 去除无用字段
利用loc函数单独切片提取出数据集的两列数据
useless_column = df.loc[:,['Indicator Name','Indicator Code']]
我们观察其前后各三行
| index | Indicator Name | Indicator Code |
|---|---|---|
| 0 | GDP(现价美元) | NY.GDP.MKTP.CD |
| 1 | GDP(现价美元) | NY.GDP.MKTP.CD |
| 2 | GDP(现价美元) | NY.GDP.MKTP.CD |
| 263 | GDP(现价美元) | NY.GDP.MKTP.CD |
| 264 | GDP(现价美元) | NY.GDP.MKTP.CD |
| 265 | GDP(现价美元) | NY.GDP.MKTP.CD |
对于各实体均重复相同的值,无法为我们的数据挖掘提供有差别/有价值的信息,我们直接将整列删除。
print("进行删除前数据集的列数为:"+str(df.shape[1]))
df.drop(labels = 'Indicator Name',axis = 1,inplace = True)
df.drop(labels = 'Indicator Code',axis = 1,inplace = True)
print("完成删除后数据集的列数为:"+str(df.shape[1]))
(2) 确定缺失值
利用函数isnull确定表格内的空值数目
df.isnull().sum()
Country Name        2
Country Code        0
Indicator Name      0
Indicator Code      0
1960              138
                 ...
2016               10
2017               10
2018               10
2019               13
2020               24
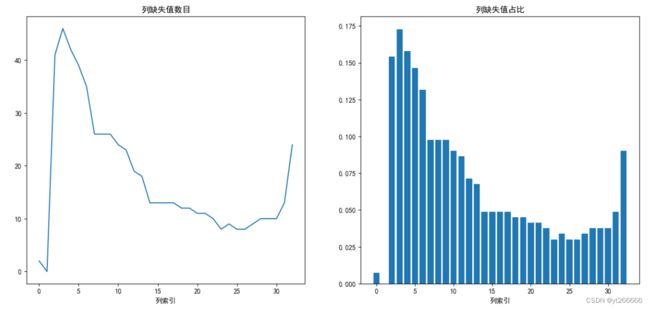
绘制图像更加直观地观察缺失值数目
x = np.arange(0, df.shape[1])## 生成x轴数据
y = list(df.isnull().sum())## 生成y轴数据
plt.figure(figsize=(16,7))## 设置画布
plt.subplot(1, 2, 1)
## 原图
plt.plot(x,y)## 绘制sin曲线图
plt.title('列缺失值数目')
# plt.savefig('gen_pics/缺失值曲线.png')
plt.xlabel('列索引')## 添加横轴标签

plt.subplot(1, 2, 2)
x = np.arange(0, df.shape[1])## 生成x轴数据
y = list(i/df.shape[0] for i in df.isnull().sum())## 生成y轴数据
## 绘制散点1
plt.bar(x,y)

plt.xlabel('列索引')## 添加横轴标签
plt.title('列缺失值占比')
plt.show()
发现近乎每一列都存在缺失值 ,甚至在1960-1970期间,GDP数据缺失值占比均超过40%
(3) 去除过多缺失的行列
我们设定缺失值占比高于20%的列 便直接删除
这里删除的数量可能有些太多了 主要是展示一下方法。
for name in df.columns:
    if (df[name].isnull().sum()/df.shape[0])>0.2:
        df.drop(labels = name,axis = 1,inplace = True)
当前数据集保留着各国1990-2020年的GDP数据 缺失值占比均低于20%
再次观察列缺失值情况
能够感受到缺失值情况相较之前要良好了许多。
同上 对行做类似的处理 去除那些缺失值过多的国家。
(4) 填充缺失值
线性插值 关键代码如下:
# 对列进行前向线性插值
df = df.interpolate(method='linear', axis=0,inplace=False,limit_direction='forward')

# 对列进行后向线性插值
df = df.interpolate(method='linear', axis=0,inplace=False,limit_direction='backward')
注意数据类型的转化 只有数值型才能够进行插值。
(5) 检验异常值
数据的数值分布几乎全部集中在区间(μ-3σ,μ+3σ)内,可以认为超出3σ的部分为异常数据。
for name in df.columns:
    min_GDP = df[0] < (df[0].mean() - 3*df[0].std())
    max_GDP = df[0] > (df[0].mean() + 3*df[0].std())

    GDP_fit = min_GDP | max_GDP
    print(df.loc[GDP_fit,0])
也可以通过箱线图更加直观地观察异常值
label= ['南非','阿根廷','津巴布韦']## 定义标签
gdp = (list(b[263]),list(b[9]),list(b[265]))
plt.figure(figsize=(6,4))
plt.boxplot(gdp,labels = label)
plt.title('国民生产总值箱线图')
plt.show()
若发现异常值 对其进行清除或是平滑化处理。
(6) 其余步骤
此数据集质量较高 完整数据清洗还应包括其余步骤:
- 去除不合理的值,例如某国超过全球总量的GDP数值
- 去除符号错误,例如GDP字段内填写了文字
- 去除重复行列, 例如一年的GDP统计了两次
- 相关性检验,计算各字段间的相关性。
- 等等


