统计分析方法论-----逻辑回归
numpy知识点:np.linspace(start,end,num)返回等差数列,如np.linspace(-10,10,200)
np.argmax(array,axis=0) #返回每列中最大值的索引
np.argmax(array,axis=1) #返回每行中最大值的索引
np.meshgrid(x,y)#返回对应坐标向量的坐标矩阵,如x=[1,2,3],y=[5,6],返回[array([[1, 2, 3],
[1, 2, 3]]), array([[7, 7, 7], [8, 8, 8]])]
1、逻辑回归模型
1.1逻辑回归含义
逻辑回归其实是一个分类算法,用于对样本数据进行分类的场景
1.2、逻辑回归算法模型
分类的依据为计算一个阈值,超过为A类,未超过为B类。
模型的理解:如2个参数即因变量x1和x2,那么阈值(决策边界的线)就是w1x1+w2x2+b=0这条直线(x1作为x轴,x2作为y轴,以此将平面分为2块,w1x1+w2x2+b结果即z大于0的部分为A类,z小于0的部分为B类)
1.3、sigmoid函数
理解sigmoid函数
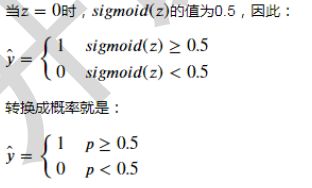
把z值(﹣∞,∞)转换为概率值,sigmoid函数的取值范围变得有界(0或1),同时也是一个概率的取值范围
sigmoid的输出p作为正例的概率,1-p即为负例的概率;p和1-p哪个大,那么预测的结果就属于对应类别

如何判断结果,先计算z,得到z后计算sigmoid(z),若大于0.5则结果为类别1,若小于0.5则结果为类别0。
二分类:结果有2中类别

reshap之后的依旧是二维
- 代码验证sigmoid函数
#验证sigmoid函数
iris=load_iris()
def sigmoid(z):
    return 1/(1+np.exp(-z))
#返回等差数列
z=np.linspace(-10,10,200)
plt.plot(z,sigmoid(z))
plt.axvline(x=0,ls='--')
plt.axhline(ls=':')
plt.axhline(y=0.5,ls=':')
plt.axhline(y=1,ls=':')
plt.xlabel('z值')
plt.ylabel('sigmoid值')
plt.show()
2、使用逻辑回归算法实现二分类
2.1、代码实现
#使用逻辑回归实现二分类
iris=load_iris()

X,y=iris.data,iris.target
#暂时使用2个花瓣特征(一共4个,X值)和2个类别(一共3类,y值)进行计算#
#首先使用y!=0过滤X的行数,把类别0的数据去掉;然后取2-3列,即2个花瓣特征
X=X[y!=0,2:]
y=y[y!=0]
#拆分数据集
X_train,X_test,y_train,y_test=train_test_split(X,y,test_size=0.25,random_state=2)
lr=LogisticRegression()
#训练模型
lr.fit(X_train,y_train)
#通过模型预测结果
y_hat=lr.predict(X_test)
print('权重:',lr.coef_)
print('截距',lr.intercept_)
print('真实值:',y_test)
print('预测值:',y_hat)
结果
权重: [[-0.12107795  2.34770742]]
截距 [-3.03870143]
真实值: [2 1 2 1 1 1 1 1 1 1 2 2 2 1 1 1 1 1 2 2 1 1 2 1 2]
预测值: [1 1 2 1 1 1 1 2 1 1 2 2 2 1 1 1 1 1 2 2 2 1 1 1 2]
2.2、结果可视化
可视化,注意横坐标是花瓣长度,纵坐标是花瓣宽度。类别通过颜色分类
#可视化,注意横坐标是花瓣长度,纵坐标是花瓣宽度。类别通过颜色分类
s1=X[y==1]
s2=X[y==2]
plt.figure(figsize=(20,8),dpi=80)
plt.scatter(x=s1[:,0],y=s1[:,1],c='r',label='类别1')
plt.scatter(x=s2[:,0],y=s2[:,1],c='g',label='类别2')
#plt.plot(X,lr.predict(X))
plt.legend()
plt.show()
3、代码计算各类别的概率
计算概率值
由于返回的是属于每个类别的概率,我们要取概率大的那个最为结果类别,使用np.argmax返回最大值的索引
#计算类别概率
probability=lr.predict_proba(X_test)
print(probability[:10])
#所属类别,np.argmax返回最大值的索引
print(np.argmax(probability,axis=1))
#可视化
#数据个数作为x轴坐标
index=np.arange(len(X_test))
tick_label=np.where(y_test==y_hat,'o','X')
p1=probability[:,0]
p2=probability[:,1]
plt.bar(index,height=p1,label='类别0概率',tick_label=tick_label)
plt.bar(index,height=p2,bottom=p1,color='r',label='类别1概率')
plt.legend(loc='best',bbox_to_anchor=(1,1))
plt.show()
结果
[[0.5336087  0.4663913 ]
 [0.71429158 0.28570842]
 [0.39949963 0.60050037]
 [0.6241773  0.3758227 ]
 [0.51549281 0.48450719]
 [0.68794273 0.31205727]
 [0.52757755 0.47242245]
 [0.41410733 0.58589267]
 [0.51549281 0.48450719]
 [0.57956243 0.42043757]]
[0 0 1 0 0 0 0 1 0 0 1 1 1 0 0 0 0 0 1 1 1 0 0 0 1]
4、绘制决策边界
np.meshgrid
x.ravel()
enumerate(x)
#决策边界
from matplotlib.colors import ListedColormap
def plot_decision_boundary(model,X,y):
    color=['r','g','b']
    marker=['o','v','x']
    class_label=np.unique(y)
    cmap=ListedColormap(color[:len(class_label)])
    #按照axis=0选出最小值,即花瓣宽度最小值,花瓣长度最小值
    x1_min,x2_min = np.min(X,axis=0)
    x1_max, x2_max = np.max(X, axis=0)
    x1 = np.arange(x1_min-1,x1_max+1,0.02)
    x2 = np.arange(x2_min - 1, x2_max + 1, 0.02)
    X1,X2=np.meshgrid(x1,x2)
    Z=lr.predict(np.array([X1.ravel(),X2.ravel()]).T).reshape(X1.shape)
    #等高线
    plt.contourf(X1,X2,Z,camp=cmap,alpha=0.5)
    for i,class_ in enumerate(class_label):
        plt.scatter(x=X[y==class_,0],y=X[y==class_,1],c=cmap.colors[i],label=class_,marker=marker[i])
    plt.legend()
    plt.show()
    #print(X1)
    #print(X2)
    #print(X1.shape)
plot_decision_boundary(lr,X_train,y_train)


