画图: Python画矩形框
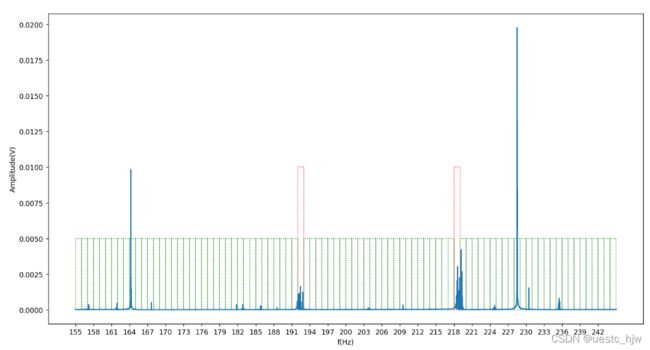
实际效果:
1. 核心函数:patches.Rectangle()
参数分别是:左下角顶点坐标,width即向右,height即向上,facecolor='none'会只有框,本身 没颜色
2. 我要画多个矩形
直接currentAxis.add_patch(rect),最后plt.show()
3. 设置坐标轴刻度范围:plt.xticks(range(155000,245000,3000),range(155,245,3))
import matplotlib.pyplot as plt
import matplotlib.patches as patches
                x = np.arange(155000,245000)
                sample = val_data[6,:,0].numpy()
                plt.figure()
                plt.plot(x,sample)
                currentAxis = plt.gca()
                num = begin # 155000
                for kk in label_1:
                    if int(kk) == 1:
                        rect = patches.Rectangle((num,0),1000,0.01,linestyle = 'dotted',edgecolor = 'r',facecolor = 'none')
                    else:
                        rect = patches.Rectangle((num,0),1000,0.005,linestyle = 'dotted',edgecolor = 'g',facecolor = 'none')
                    currentAxis.add_patch(rect)
                    num += 1000
                plt.xlabel('f(Hz)')
                plt.ylabel('Amplitude(V)')
                plt.xticks(range(155000,245000,3000),range(155,245,3)) # 设置坐标刻度,前面是刻度实际宽度,后面是显示出来的文字
                plt.show()
4. 图例+坐标轴+刻度值 字体和大小的调整
import matplotlib.pyplot as plt
import numpy as np
import math

x = np.arange(0,1,0.001)
y = x
y1 = [2/(1+math.sqrt(1+8*0.8/(i**2))) for i in x]
y2 = [2/(1+math.sqrt(1+8*0.02/(i**2))) for i in x]
y3 = [2/(1+math.sqrt(1+8*0.005/(i**2))) for i in x]

loc1,loc2 = 0,0
for i in range(len(x)):
    if y2[i]
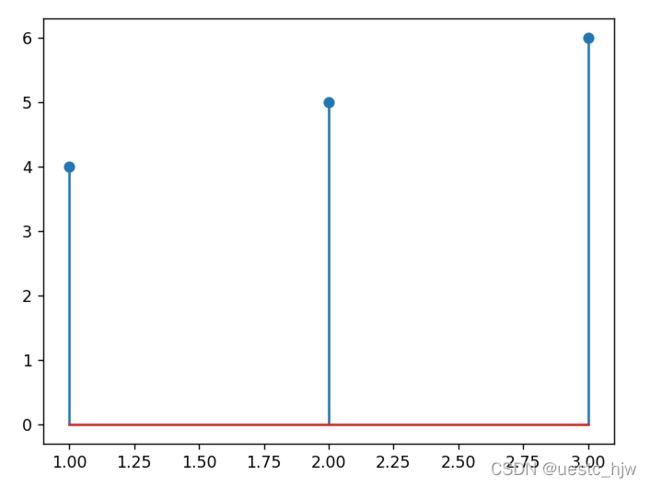
5. 绘制茎叶图(杆图)plt.stem()
x = [1,2,3]
y = [4,5,6]
plt.stem(x,y)
plt.show()
6. 三维散点图,颜色代表数值大小
画图技巧:若一个图太密,可视化后不好看,就采样可视化
from mpl_toolkits.mplot3d import Axes3D
import matplotlib.pyplot as plt
fig = plt.figure()
ax = fig.add_subplot(111, projection="3d")
ax.set_xlabel("Lat")
ax.set_ylabel("Long")
ax.set_zlabel("Height")
x=  [1,2,3,4]
y = [8,6,3,5]
z = [4,6,2,3]
density = [9,5,2,7]
ax.scatter(x, y, z, c=density)
plt.show()
plt.savefig(f'./{a}.png')


