class scipy.interpolate.interp1d(x, y, kind='linear', axis=-1, copy=True, bounds_error=None, fill_value=nan, assume_sorted=False)
解释一
import numpy as np
import matplotlib.pyplot as plt
from scipy import interpolate
x = np.arange(0, 10)
y = np.exp(-x/3.0)
f = interpolate.interp1d(x, y)
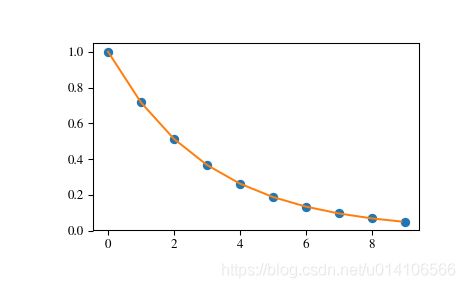
#定义了x和y的坐标,即下图中的10个点

#xnew是我们自己设的坐标,即利用上面的 f 根据xnew得到ynew,并将ynew用直线连接起来
 xnew = np.arange(0, 9, 0.1)
 ynew = f(xnew)   # use interpolation function returned by `interp1d`
 plt.plot(x, y, 'o', xnew, ynew, '-')
 plt.show()
结果如下图

解释二
import matplotlib.pyplot as plt
import numpy as np
from scipy.interpolate import interp1d
#interp1d表示1维插值

x = np.linspace(0, 10, num=11, endpoint=True)
y = np.cos(-x**2/9.0)
f = interp1d(x, y)
f2 = interp1d(x, y, kind='cubic')
#kind='cubic' 省去kind参数  默认为线性插值

xnew = np.linspace(0, 10, num=41, endpoint=True)
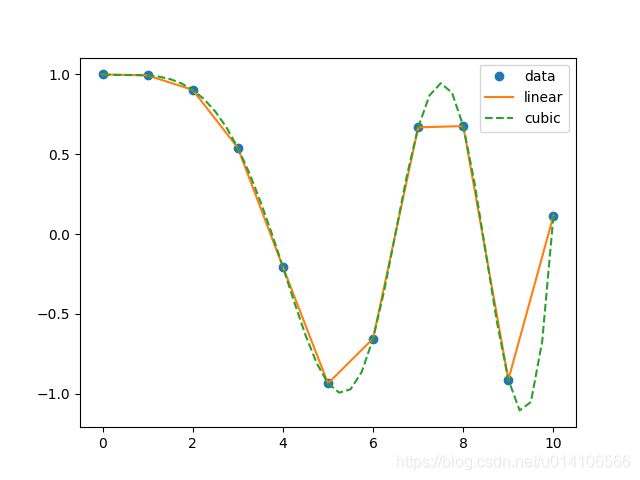
#xnew表示插值之后,画图,选取的画图点数,再用线将这些点连起来

plt.plot(x, y, 'o', xnew, f(xnew), '-', xnew, f2(xnew), '--')
plt.legend(['data', 'linear', 'cubic'], loc='best')
plt.show()
#插值的方法 通过kind 导入;
f2 = interp1d(x, y, kind='cubic') 返回一个插值后的函数
结果如下图所示:

例子2
import matplotlib.pyplot as plt
import numpy as np
from scipy.interpolate import interp1d


x = np.linspace(0, 10, num=11, endpoint=True)
y = np.cos(-x**2/9.0)
f1 = interp1d(x, y, kind='nearest')
f2 = interp1d(x, y, kind='zero')
f3 = interp1d(x, y, kind='quadratic')

xnew = np.linspace(0, 10, num=1001, endpoint=True)
plt.plot(x, y, 'o')
plt.plot(xnew, f1(xnew), '-', xnew, f2(xnew), '--', xnew, f3(xnew), ':')
plt.legend(['data', 'nearest', 'zero', 'quadratic'], loc='best')
plt.show()
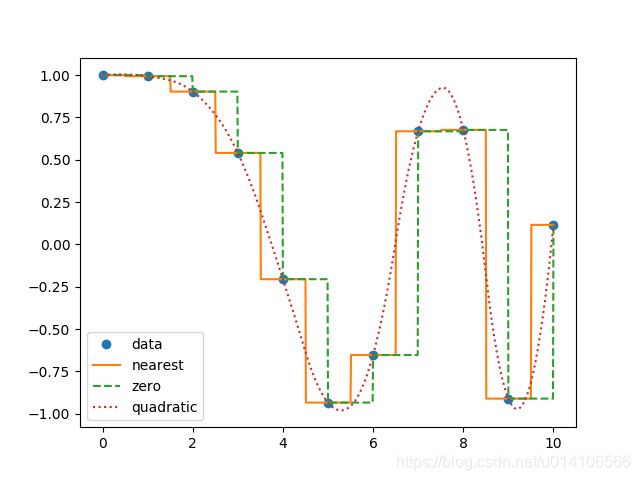
运行结果:


